Critical Junctions
Identify the identities in your environment that sit at the highest-risk convergence points in the access graph — the accounts that, if compromised, provide an attacker with the most efficient paths to your critical assets.
Requires role: Operator (viewing junctions and visualizations) / Admin (triggering manual recalculation)
Related: Asset Criticality Engine | Risk Posture Dashboard | Select Fire | Multi-Agent Intelligence | Graph Explorer | Identity Inventory
Overview
Not all accounts in your environment are equally dangerous to an attacker. Most accounts are dead ends — compromising them gives an attacker access to a limited set of resources with no path forward. A small number of accounts are different: they sit at points where many access paths converge, acting as bridges between low-privilege and high-privilege zones. These are Critical Junctions.
The Critical Junction Engine scans every attack path in your identity graph and identifies the accounts that appear most frequently on the shortest, most exploitable routes to your critical assets. The result is a ranked list of structural pivot points — accounts where a single compromise would give an attacker the most leverage.
What makes this analysis different from a simple "who has access to what" report is the scoring model. The engine uses Lateral Movement Centrality (LM), a composite score that measures two things simultaneously:
- How close is this account to critical assets? An account that is one hop from Domain Admins via a confirmed DCSync permission scores much higher than one that is five hops away via a chain of low-fidelity group memberships.
- How many attack paths pass through this account? An account that sits on 80% of all attacker routes from standard users to critical targets is far more dangerous than one that appears on a single path.
The score also factors in Tiered Fidelity — permissions that have been validated by observed activity cost less for an attacker to traverse than theoretical permissions that have never been exercised. This prevents low-confidence data from inflating scores.
The end result is a ranked list where the top entry is not just "connected to many critical assets" but is genuinely the account an attacker would most want to compromise.
Prerequisites
- Role: Operator or higher to view the Junctions page and visualizations; Admin to trigger manual recalculation
- Data: At least one successful identity sync with critical assets classified by the Asset Criticality Engine — junctions are scored relative to CRITICAL-tier targets, so if no CRITICAL assets exist, no junctions will be identified
- Criticality evaluation: The background worker must have completed at least one criticality evaluation cycle after the most recent sync — see the Asset Criticality guide for details
- Graph data: The analysis is most meaningful in environments with at least 10 CRITICAL-tier assets and a non-trivial access graph; sparse graphs with few connections between accounts may produce empty results
Junction analysis runs automatically after each full sync. Results are cached and served instantly — you do not need to wait for a recalculation to view data after a sync.
How Junction Scoring Works
The LM Score
Each junction receives a single LM Score between 0 and 1. Higher scores indicate greater risk. The score combines two measurements:
Proximity to critical assets — How close this account is to high-value targets (Domain Admins, Domain Controllers, etc.) via the cheapest attack paths. Accounts that are one or two exploitable steps away score high. Accounts that are many steps away via theoretical permissions score low. Higher-criticality targets contribute proportionally more to the score.
Route convergence — What fraction of attacker routes through your environment pass through this account. An account that sits on many shortest paths between entry points and critical targets scores high because removing it would force attackers to take longer, more expensive detours.
The engine automatically balances these two measurements based on your graph's structure. The balance factor (alpha) is shown in the detail flyout for transparency but does not need configuration.
Attack Cost
The scoring model assigns a cost to every permission in the graph based on two factors:
| Factor | Effect on Cost |
|---|---|
| Fidelity Tier 3 (Validated) | Low cost — the permission has been observed in use |
| Fidelity Tier 2 (Constrained) | Medium cost |
| Fidelity Tier 1 (Theoretical) | High cost — the permission exists in policy but may never be exercised |
| High-severity permission (e.g., DCSync, WriteDACL) | Low cost — highly exploitable |
| Low-severity permission | Higher cost |
| Structural relationship (MemberOf, ContainedIn) | Fixed high cost — these are organizational relationships, not attack vectors |
Lower total path cost = more exploitable route = higher junction score for any account on that route.
What the Score Colors Mean
The junctions table color-codes LM scores for quick triage:
| Score Range | Color | Meaning |
|---|---|---|
| > 0.8 | Red | Highest priority — address immediately |
| 0.5 – 0.8 | Orange | High risk — schedule remediation |
| < 0.5 | Muted | Lower risk — monitor |
Using the Critical Junctions Page
Navigate to Critical Junctions in the left sidebar to open the analysis page.
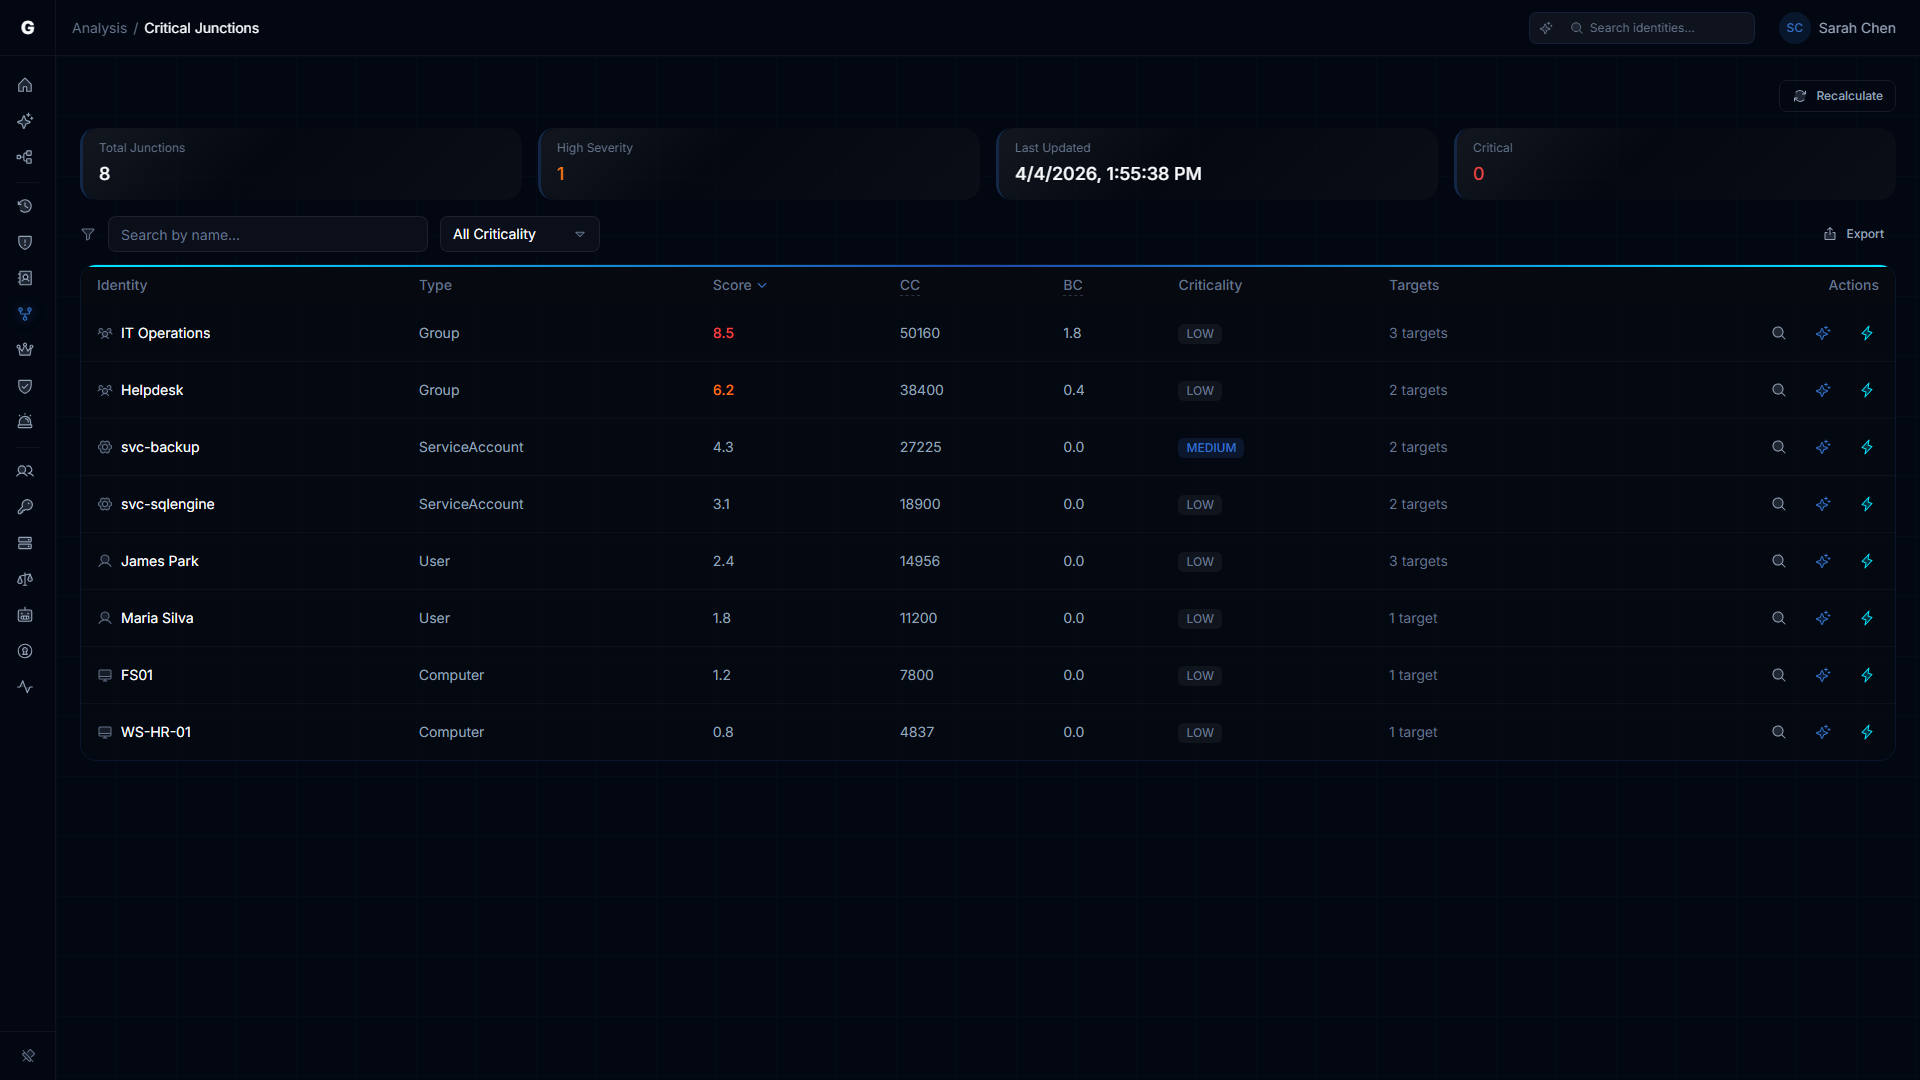
Summary Cards
Four cards at the top of the page provide a quick status overview:
- Total Junctions — how many accounts the engine identified as convergence points
- High Severity — how many of those junctions have an LM score above 0.8 (highest priority)
- Last Updated — when the most recent analysis ran
- Critical — how many junctions are themselves classified as CRITICAL-tier assets
If all four cards show zero or "Never" in the Last Updated field, junction analysis has not run yet. An Admin can trigger a manual recalculation (see Triggering a Recalculation).
The Junctions Table
The table lists all identified junctions with the following columns:
| Column | Description |
|---|---|
| Identity | Account display name. Click to open the detail flyout. |
| Type | Account type: User, Group, Computer, ServiceAccount, etc. |
| Score | The LM score (0–1). Color-coded by severity. Click the column header to sort. |
| CC | Closeness Centrality component. How close this account is to critical targets. |
| BC | Betweenness Centrality component. What fraction of attack paths pass through this account. |
| Criticality | The account's own criticality tier as classified by the Asset Criticality Engine. |
| Targets | How many critical targets this account can reach. |
| Actions | Per-row action buttons (see below). |
Click any column header to sort the table by that column. Click again to reverse the sort order. The table defaults to sorting by LM Score (highest first).
Per-Row Actions
Each row in the table has up to three action buttons on the right:
- Investigate in Graph (magnifying glass) — opens the Graph Explorer focused on this account, so you can manually explore its connections
- Explain with Graphne (sparkle icon, Operator+, requires AI configured) — opens the AI assistant with context pre-loaded about this junction, asking it to explain why this account was flagged
- Select Fire (lightning bolt, Operator+) — opens the Select Fire action modal for remediation planning, pre-loaded with this junction as the subject
Opening the Detail Flyout
Click any identity name in the table to open a detail flyout panel on the right side of the screen. The flyout shows:
Junction Score — the LM score displayed as a number and a progress bar.
Score Breakdown — the three LM components (Closeness, Betweenness, Alpha) displayed side by side. Use these to understand the nature of the risk:
- High CC + Low BC = this account is dangerously close to a few critical targets
- Low CC + High BC = this account is a transit point for many different attack routes
- High CC + High BC = both problems — highest priority for remediation
Account Details — type and criticality tier.
Attack Paths — the top attack paths from this junction to critical targets. Each path shows:
- The target's name and criticality level
- The total path cost (lower = more exploitable)
- Each hop in the path, with the permission type used and its individual cost
Target Breakdown — a bar chart showing the types of critical targets reachable (Groups, Users, Computers, etc.) proportional to count.
Reachable Targets — if no attack paths are available, a list of all critical targets reachable from this junction. Click any target to open it in the Graph Explorer.
Properties — raw account attributes from the last sync.
At the bottom of the flyout, two buttons are available:
- View in Graph — opens the Graph Explorer focused on this account
- Select Fire — launch the remediation workflow for this junction
Junction Flow Visualization
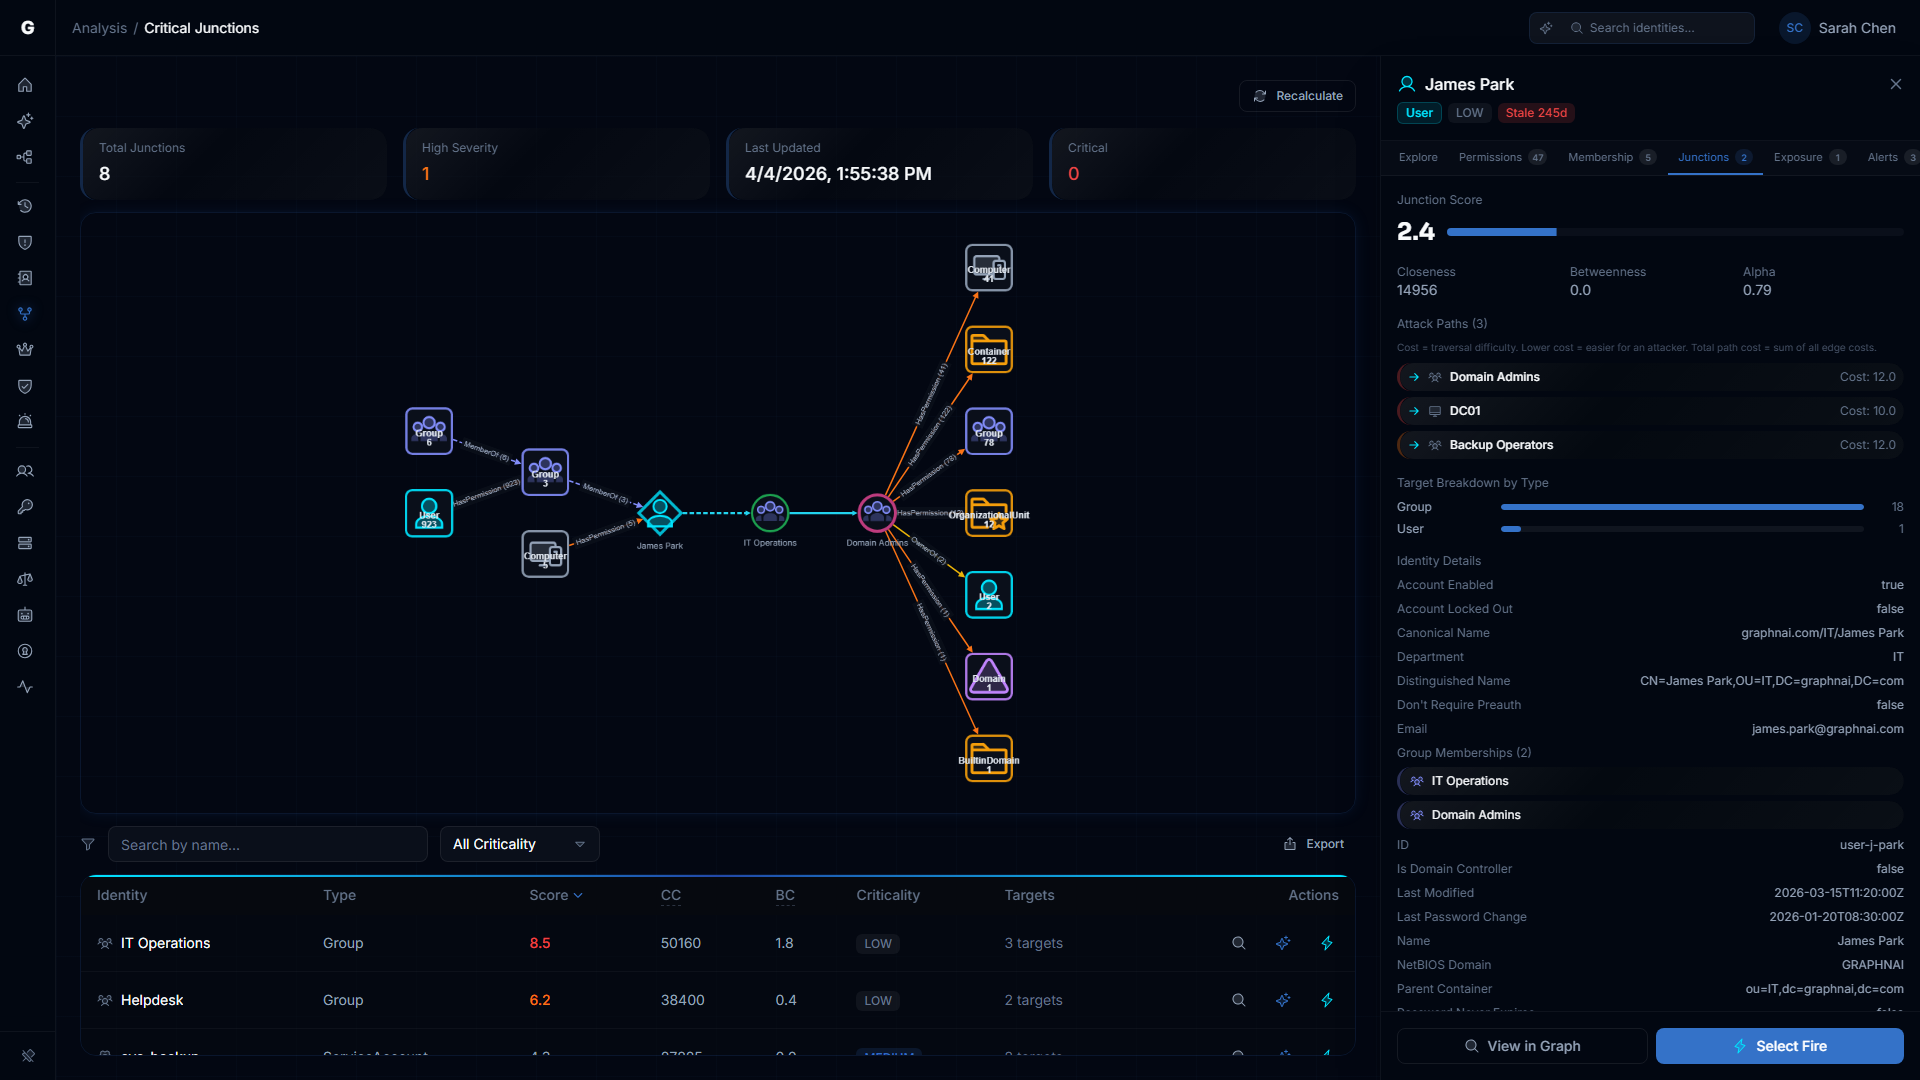
Clicking a junction row opens the split-view layout with an integrated junction flow graph on the left and the detail flyout on the right. The flow graph combines three layers of attack intelligence into a single connected visualization:
Inbound Sources (left side)
Aggregate nodes on the left show the accounts that can reach the junction — the attacker's approach routes. Each aggregate node represents a type of account with a count (e.g., "Group 6" means 6 groups at that hop distance). Edges are labeled with the relationship type and count (e.g., "MemberOf (4)").
Read the left side from left to right: sources fan in toward the junction. The further left an account type appears, the more steps an attacker would need to reach the junction. Large aggregate counts (e.g., "User 923") indicate a wide exposure surface.
Shortest Attack Path (center)
The center of the graph shows the direct path from the junction to its highest-priority target. Named identity nodes are connected by labeled permission edges. The junction is highlighted with a cyan diamond; the target with a pink border.
This is the specific attack chain — the permissions an attacker would exploit to traverse from the junction to the critical asset. Breaking any edge on this path severs the attack route.
Outbound Blast Radius (right side)
Aggregate nodes on the right show what the target can reach — what an attacker gains once they arrive. The target fans out to aggregate nodes representing computers, groups, OUs, containers, and domains reachable through the target's permissions.
Use this to understand why the target matters: if Domain Admins fans out to 41 computers, 122 containers, and 78 groups, that confirms domain-wide control.
Interacting with the Graph
- Zoom and pan — scroll to zoom, click and drag to pan
- Click aggregate nodes to drill down and see the individual identities within that group
- Select a different target from the attack paths list in the flyout to re-render the graph for that target's path
Triggering a Recalculation
Requires role: Admin
Junction analysis runs automatically after each full sync. If you need to force a fresh calculation — for example, after creating new criticality rules that changed which assets are CRITICAL — you can trigger a manual recalculation.
- Navigate to Critical Junctions in the sidebar
- Click the Recalculate button in the page header (visible to Admin users only)
- A dialog appears with two settings:
- Max Junctions: the maximum number of junction results to return (default 50, max 500)
- Traversal Depth: how many hops to follow when computing paths (default 5, max 20)
- Click Recalculate to start the analysis
The recalculation runs synchronously — the button shows a loading state until it completes. For large environments, this may take up to two minutes. The page updates automatically when complete.
Increasing Traversal Depth beyond 5 can significantly increase calculation time. The default of 5 hops is appropriate for most Active Directory environments. Consider increasing it only if you have deep service account chains or multi-domain trust paths you need to capture.
Integration with Other Features
Risk Posture Dashboard
The Risk Posture Dashboard uses junction data as one component of the composite risk score. The count of high-LM-score junctions (score > 0.8) contributes to the overall risk calculation. After a recalculation produces new junction data, the Risk Posture Dashboard will reflect the updated score on its next load.
Select Fire
Every junction in the table has a Select Fire action button. Clicking it opens the Select Fire modal with the junction account pre-loaded as the subject and "Remove Access" as the suggested operation. Select Fire lets you simulate the impact of removing a permission or disabling an account before making any changes. For high-LM-score junctions, the recommended workflow is:
- Click the junction row to open the flow visualization and understand which specific permission on the shortest path carries the most risk
- Launch Select Fire from the junction's row
- Use the Simulate mode to model what happens to the LM score if that permission is removed
- If the simulation result is acceptable, use the Decision step to proceed
See the Select Fire guide for full instructions.
AI Explanation (Graphne)
If the Graphne AI assistant is configured and available, each junction row shows an Explain button (sparkle icon). Clicking it opens an AI-generated explanation of why this account was identified as a critical junction, including the attack paths and a ranked list of remediation options.
See the Multi-Agent Intelligence guide for setup instructions.
Graph Explorer
Every junction in the table and every target listed in the detail flyout has a View in Graph action. This opens the Graph Explorer with that account in focus, showing all its direct connections. Use the Graph Explorer to investigate specific permissions that appear in the junction flow graph, or to browse the full access context around a junction.
Troubleshooting
The Junctions page shows no results
Most likely cause: Junction analysis has not run yet, or no CRITICAL-tier assets exist in the graph.
Steps to resolve:
- Navigate to Admin > Criticality Rules and confirm that at least some identities are classified as CRITICAL. If all criticality levels show as LOW, the worker may not have run — see the Asset Criticality troubleshooting section.
- Check the Last Updated card on the Junctions page. If it shows "Never," no analysis has run. An Admin can click Recalculate to trigger the first run.
- If a recalculation completes but still returns no junctions, check that your environment has at least two CRITICAL-tier assets and accounts with access paths between them. Sparse graphs with few connections may not produce any junction findings.
LM scores are all identical or very similar
Most likely cause: The analysis is running against a small graph, or all junctions connect to the same small set of targets via the same path structure.
In a small test environment with only a handful of critical targets, scores may cluster together. This is expected behavior — the differentiation becomes more pronounced as graph size increases.
If you are seeing identical scores in a large production environment:
- Check when the analysis last ran. Stale results may reflect an older, less-complete sync.
- Trigger a manual Recalculate to force fresh analysis against current graph data.
- If scores remain identical after recalculation, contact support with your junction count and target count for review.
A recalculation takes a very long time or times out
Large environments (50,000+ identities) may take up to 120 seconds for junction analysis to complete. If a recalculation appears to hang:
- Wait at least two minutes before concluding it has failed — the button will show a loading state throughout
- Reduce the Max Junctions setting (try 25 instead of 50) and the Traversal Depth (try 3 instead of 5) to reduce the computational load
- Check available memory on the database server — junction analysis performs intensive graph traversal queries that require substantial database memory
- Check the server logs for "junction calculation failed" messages, which will include the specific error
The junction flow graph shows partial or empty data
The flow graph fetches inbound sources, shortest path, and outbound blast radius independently. If one section fails, the graph still renders with partial data:
- No inbound sources: The junction has no inbound access paths — it may be an isolated node or recently-synced
- No shortest path: The engine could not find a path between the junction and its top target within the traversal depth. View the account in the Graph Explorer to investigate.
- No outbound blast radius: The critical target has no outbound access — it may be a leaf node
If the entire graph fails to load, this typically indicates a temporary database query failure. Deselect and reselect the junction row to retry.
An account I expect to see as a junction does not appear
Junction results are limited to the top N accounts by LM score (default 50 or your configured limit). An account that is technically a junction but scores below the cutoff will not appear in the table.
To investigate a specific account:
- Use the Graph Explorer to focus on the account and examine its connections directly
- If you believe the account should rank higher, consider whether its permissions have been validated (Tier 3 fidelity) — theoretical permissions contribute less to the LM score
- Trigger a recalculation with a higher Max Junctions value (up to 500) to expand the result set