Identity Investigation Timeline
A full-page investigation experience for a specific identity — combining sessions, detection alerts, and telemetry events in a chronological timeline with behavioral context, investigation charts, and one-click remediation.
Requires role: Operator (minimum — Viewers cannot access the timeline or its underlying APIs. This is a departure from analysis pages like the Risk Dashboard where Viewers can see data but not act on it.)
Related: Telemetry Enrichment, ITDR Detection, Detection Alerts, Select Fire, Access Intelligence, Graph Explorer, Multi-Agent Intelligence
Overview
The Identity Investigation Timeline gives you a single page to investigate everything that has happened for one identity: every session it opened, every detection alert it triggered, and every raw telemetry event it generated — all sorted chronologically and filterable in real time.
Above the event list, the page surfaces a behavioral profile computed from the last 30 days of activity. This tells you at a glance whether the current activity is normal for this identity. Below the behavioral card, four interactive investigation charts let you visualize activity density, session timing, and day-of-week patterns before you dive into individual entries. When you find an entry worth acting on, you can launch Select Fire directly from the timeline without navigating away.
Prerequisites
- Telemetry pipeline operational: At least one Identity Bridge must be collecting telemetry events. See Telemetry Pipeline.
- Full sync completed: The identity must exist in the graph. Session and behavioral data are only available after a full sync.
- Operator role minimum: All timeline views require Operator role. Select Fire actions require Operator role.
- Behavioral data requirement: Behavioral summary (typical hours, hosts, anomaly score) requires at least one completed full sync with 5 or more events for that identity in the last 30 days.
Accessing the Timeline
There are three ways to open the timeline for an identity:
From the Finding Detail panel
- Select any identity from the Risk Posture Dashboard, Over-Permission Analytics, or Tier 0 Exposure page
- In the detail panel that opens on the right, click the Timeline button (clock icon) in the footer
- The timeline page opens for that identity
From the Graph Explorer context menu
- Navigate to Graph Explorer in the sidebar
- Right-click any identity node
- Select View Timeline from the context menu
From Detection Alerts
- Navigate to Analysis > Detection Alerts
- In any alert row, open the row actions menu
- Select View Timeline to open the timeline for the alert's subject identity
Page Layout
The page is organized top to bottom:
- Header — Back button, identity name, type badge (color-coded by identity type), criticality badge, Tier 0 indicator (if applicable), and domain name. Select the View in Graph button to exit the timeline and open this identity in the Graph Explorer.
- Behavioral Summary Card — Four metrics computed from the last 30 days of activity.
- Investigation Charts — Four switchable chart views for visual analysis.
- Filter toolbar — Time range, type, severity, logon type, and text search controls.
- Timeline list — Chronological entries grouped by date, most recent first.
When you click a timeline entry, the layout shifts: a blast radius graph and a detail flyout appear below the list, and the list compresses to show context alongside the selected entry. Click the same entry again to deselect and return to the full-list view.
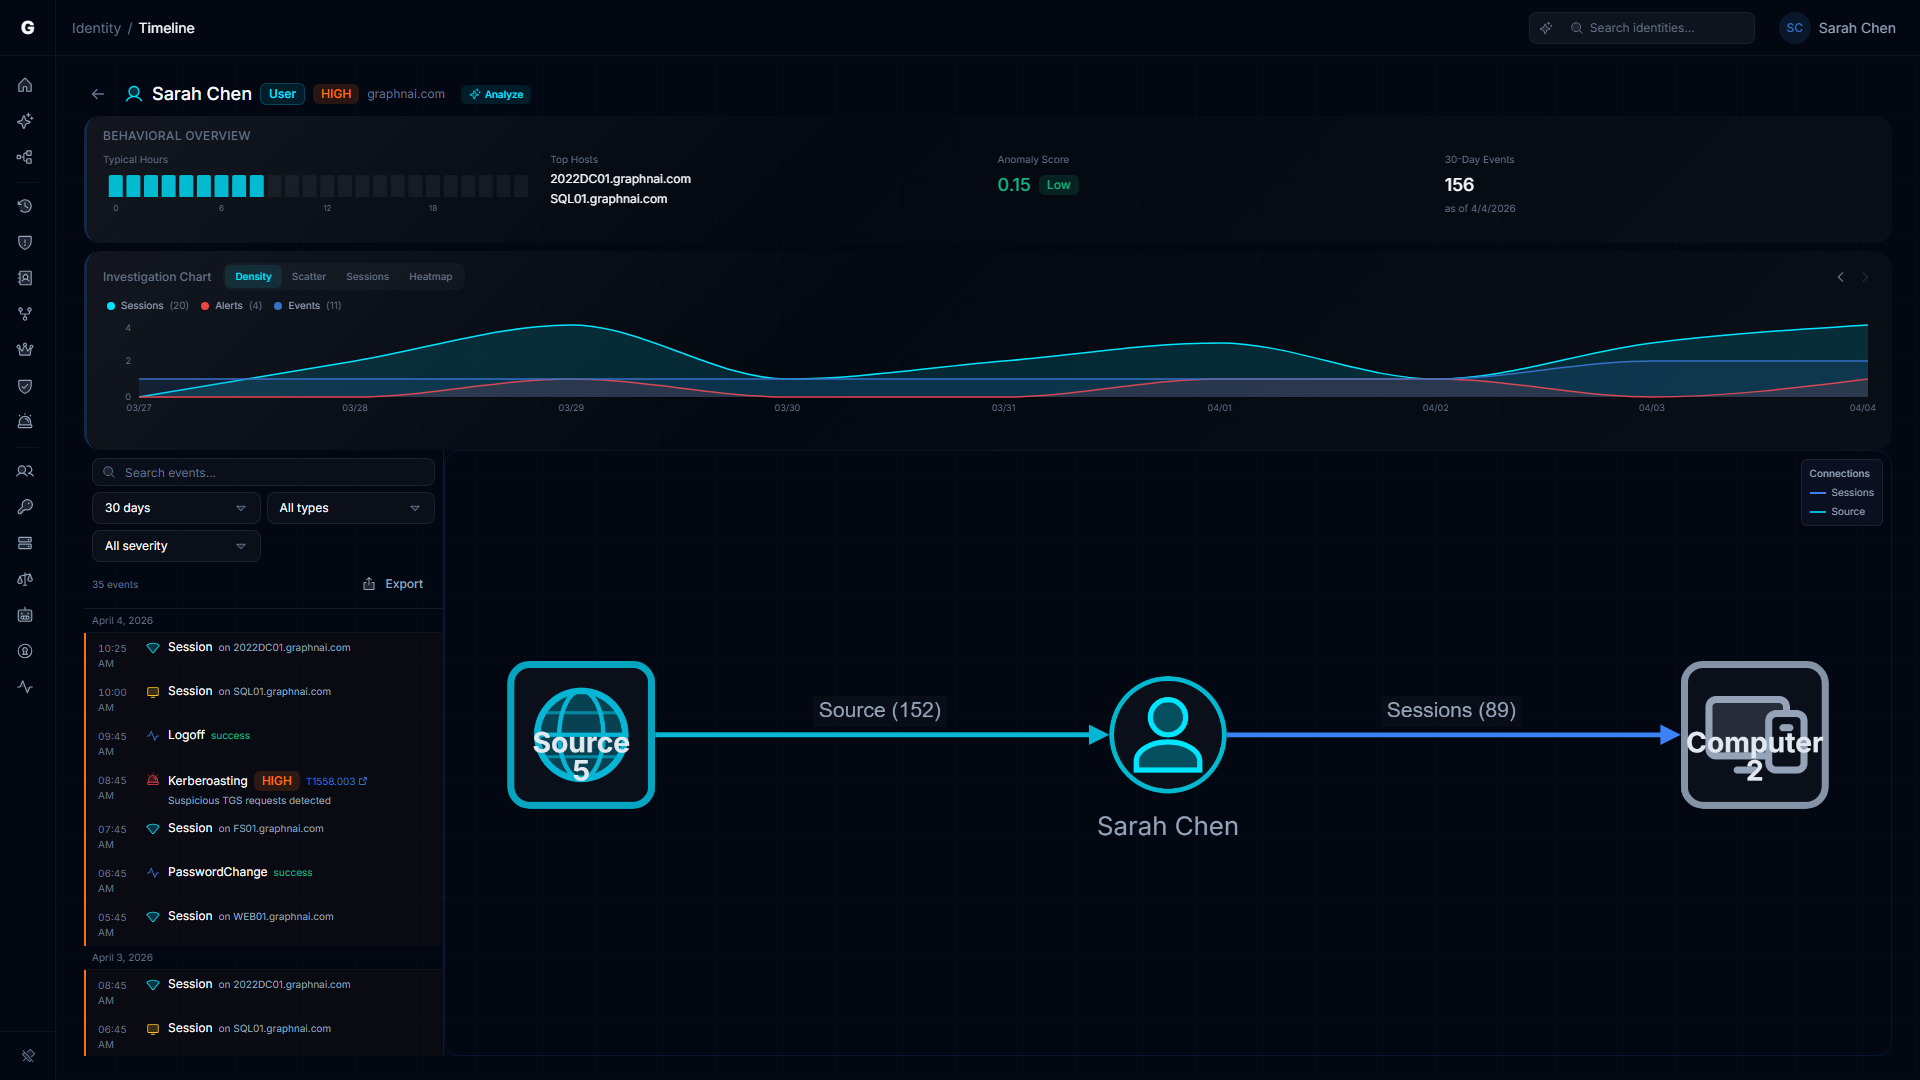
Behavioral Summary Card
The Behavioral Summary Card appears at the top of every timeline page and shows four sections:
| Section | What it shows |
|---|---|
| Typical Hours | A 24-bar chart (midnight to 11 PM) showing the hours when this identity normally authenticates. Bars are taller for hours with more historical activity. |
| Top Hosts | Up to five computers this identity connects to most frequently, by session count. |
| Anomaly Score | A score from 0.00 to 1.00 with a color-coded badge: Low (green, 0–0.30), Medium (amber, 0.31–0.60), High (red, 0.61–1.00). |
| 30-Day Events | Total number of telemetry events in the last 30 days, with the date the profile was last computed. |
Anomaly score signals
The anomaly score is a composite of behavioral risk factors. A score of 0.00 means no detected anomalies.
| Signal | Score contribution |
|---|---|
| Service account with Interactive or RemoteInteractive logons | +0.30 |
| Any NetworkCleartext authentication (plaintext credentials sent on the wire) | +0.20 |
| More than 20 failed authentication attempts in 30 days | +0.20 |
| More than 5,000 total events in 30 days (unusual volume) | +0.10 |
Score caps at 1.00. An account with only normal Kerberos network logons will correctly score 0.00.
When "No behavioral data" appears
The card shows "No behavioral data" when:
- The identity has fewer than 5 telemetry events in the last 30 days
- A full sync has not yet completed (behavioral profiles are computed after full sync only — delta syncs do not update them)
- Telemetry just started flowing and the post-sync analytics pipeline has not yet run
To refresh behavioral data sooner, trigger a manual full sync on the Bridge detail page.
Investigation Charts
The chart area sits between the Behavioral Summary Card and the timeline list. Use the segmented control to switch between four views. The selected view is saved in the URL so links preserve your context.
Density view
An area chart showing event count per time bucket over the selected date range, with three toggleable series:
- Sessions (cyan area) — Confirmed logon sessions
- Alerts (red area) — Detection alerts fired
- Events (blue area) — Raw telemetry events
Hover any point to see exact counts. Use this view to spot bursts of activity and correlate alert timing with session timing.
Scatter view
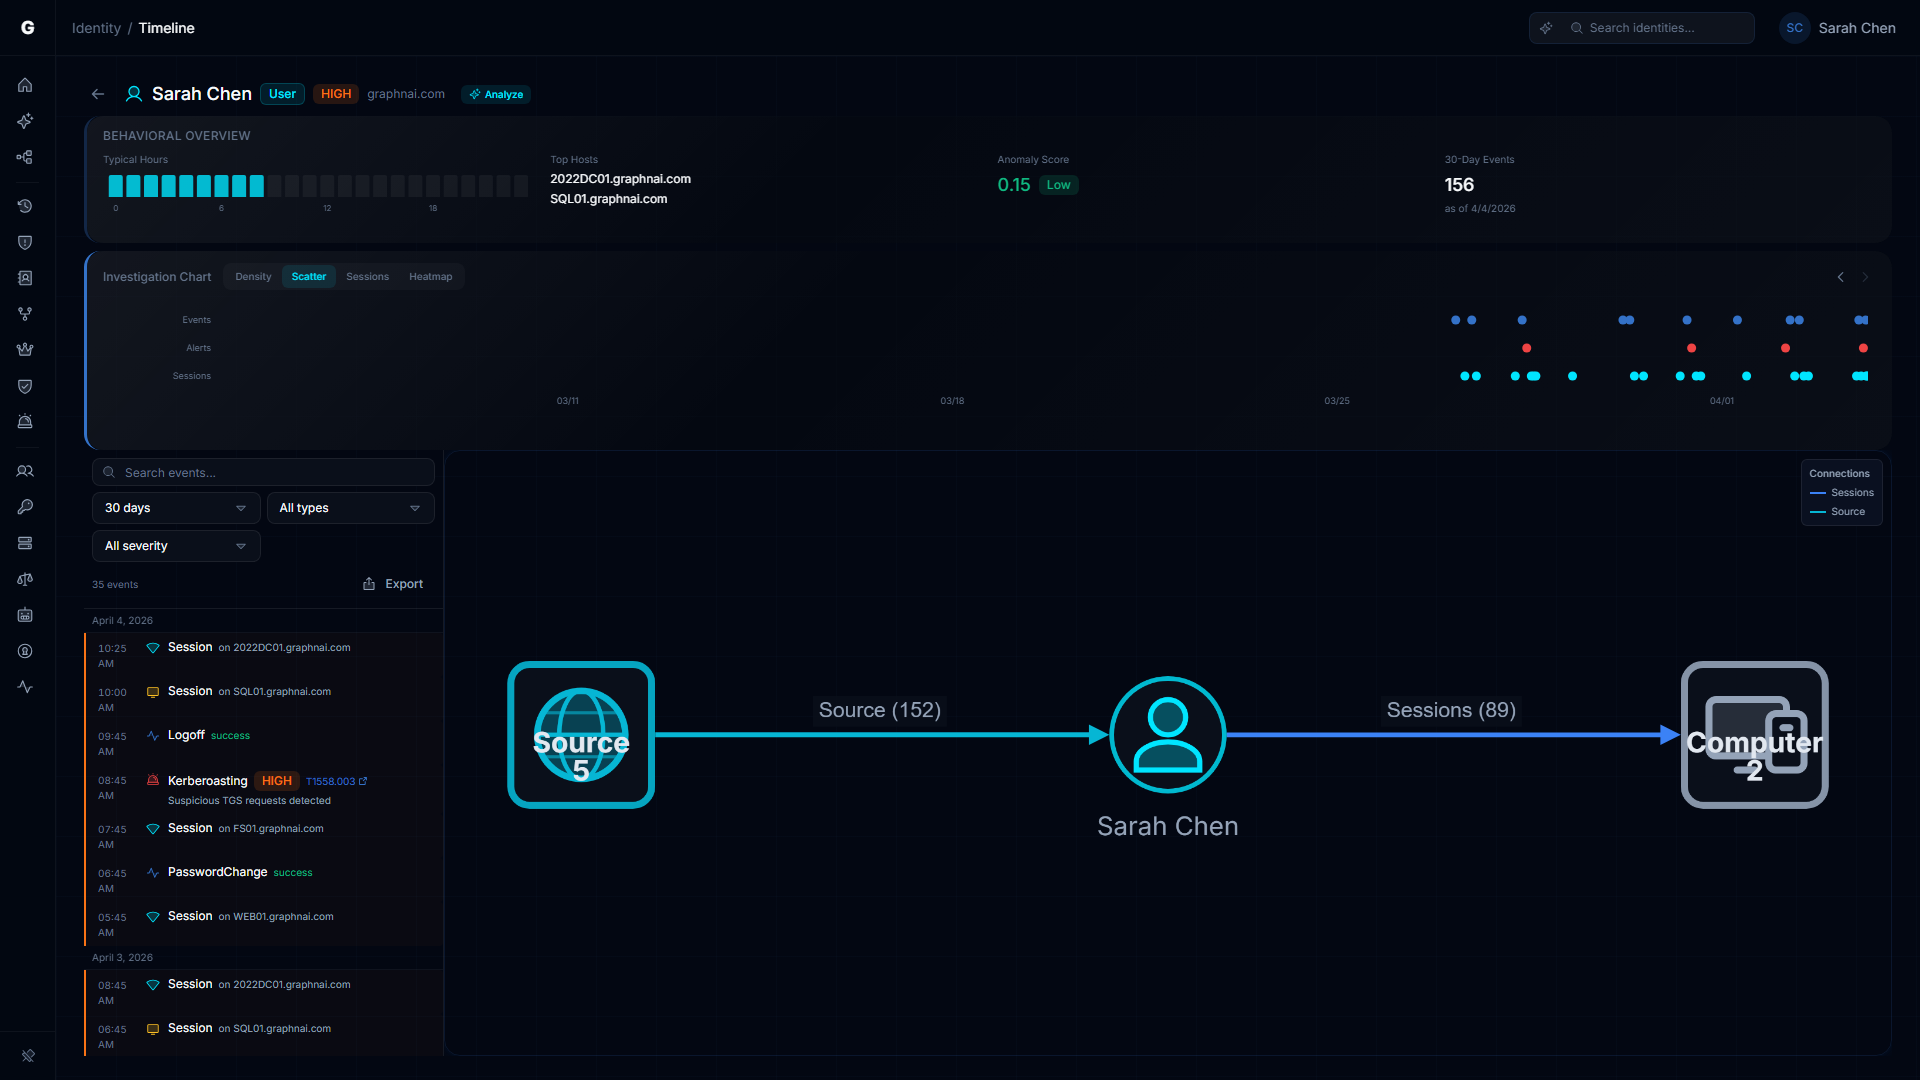
Events plotted as dots on a time axis. Dot color indicates type (cyan=session, red=alert, blue=event) and dot size indicates severity (larger=higher severity). Clicking any dot selects that entry in the timeline list and opens the detail flyout. Use scroll wheel to zoom in on dense clusters. This view makes correlated attack activity visually obvious — a cluster of red alert dots immediately before a cyan session dot is a classic brute-force-to-success pattern.
Sessions Gantt view
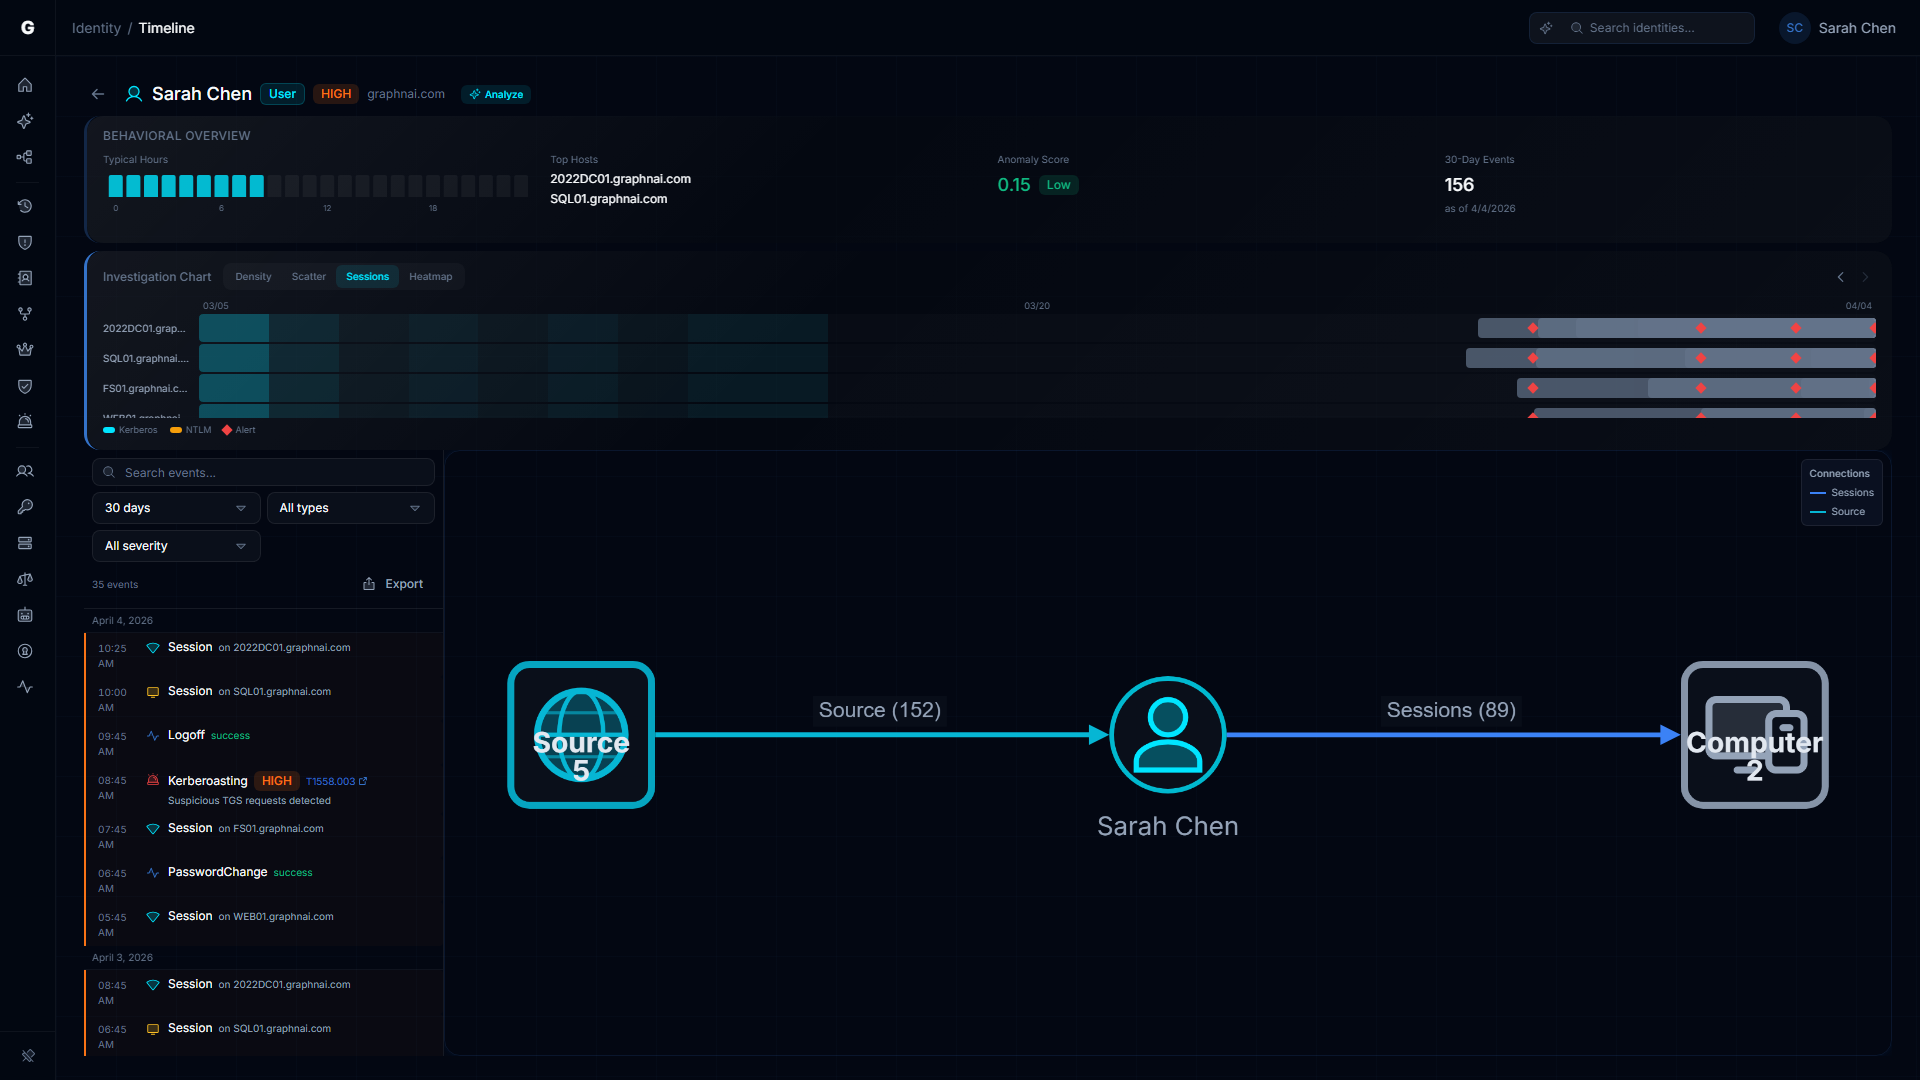
A horizontal timeline showing sessions as bars across time, with computers on the Y-axis. Each bar spans from logon to logoff. Bar color indicates authentication protocol (cyan=Kerberos, amber=NTLM). Detection alert events appear as red diamond markers at their timestamp. A light background band shows the identity's typical active hours from the behavioral profile, making off-hours sessions immediately visible.
Hover any session bar to see the logon type, duration, authentication package, and source IP.
Heatmap view
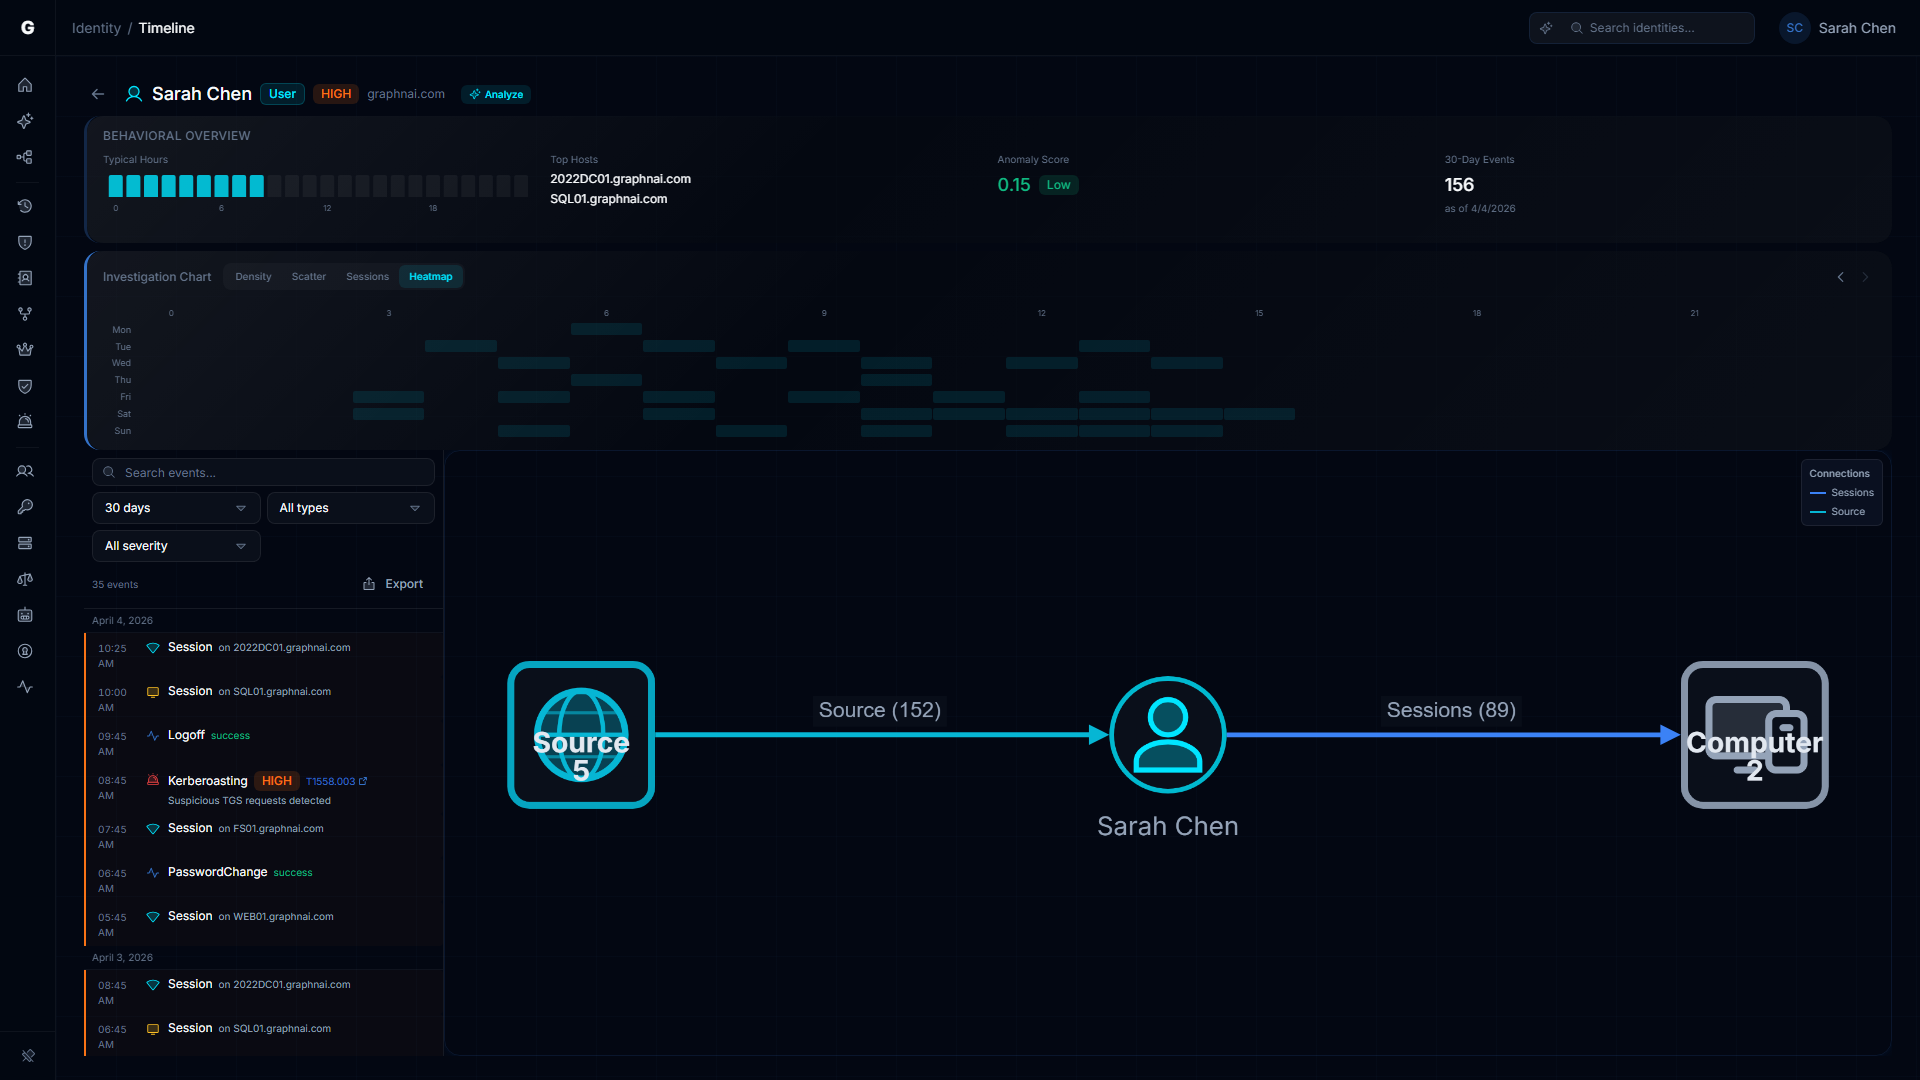
An hour-of-day (0–23) by day-of-week (Monday–Sunday) grid showing event density per cell, shaded from dark (no activity) to bright cyan (high activity). Use this view to distinguish routine patterns from true anomalies — an account that always works Tuesday through Friday 9am–5pm will have a clear pattern, and a session at 2am Saturday will stand out immediately.
Navigating time
Forward and back buttons on the chart let you page through time in increments matching your selected date range. For example, with a 7-day range selected, the back button shows the previous 7-day window.
Filtering the Timeline
All filters are synchronized to the URL. Sharing the URL preserves the current filter state for your team.
Time range
Select from preset ranges or enter a custom date range:
| Option | Description |
|---|---|
| 1 hour | Last 60 minutes |
| 24 hours | Last 24 hours |
| 7 days | Last 7 days |
| 14 days | Last 14 days |
| 30 days | Last 30 days (default) |
| 90 days | Last 90 days |
| Custom | Pick start and end dates |
Type filter
Filter by entry type: All (default), Events only, Alerts only, or Sessions only.
Severity filter
Filter alerts by severity: All (default), Critical, High, Medium, or Low. Non-alert entries always pass this filter.
Logon type filter
A multi-select popover that filters session entries by logon type. Available options are populated from the logon types actually present in the loaded data. Useful for focusing on RDP sessions or interactive logons when investigating lateral movement.
Text search
The search bar matches against: computer name, rule name, description, action, protocol, target host, source host, authentication package, logon type name, and outcome. Search is case-insensitive and updates in real time with a short debounce.
The entry count in the toolbar shows how many entries are visible after filtering (e.g., "47 of 312").
Timeline Entries
Entries are grouped by date, with sticky date separator headers. Within each date group, entries are sorted most-recent-first.
Entry types
Session entries (logon-type colored left border)
Sessions show: the logon type name, the computer name, and the authentication package. A "Restricted" badge appears when the session used Restricted Admin Mode (credentials were not cached on the target computer). Sessions use per-logon-type colors and icons to make scanning the list fast:
| Logon type | Icon | Border color |
|---|---|---|
| Interactive (2) | Keyboard | Green |
| Network (3) | Wifi signal | Cyan |
| Batch (4) | Terminal | Slate |
| Service (5) | Gear | Purple |
| Unlock (7) | Padlock open | Green |
| NewCredentials (9) | Key | Amber |
| RemoteInteractive / RDP (10) | Monitor | Amber |
| CachedInteractive (11) | Cloud-slash | Slate |
| NetworkCleartext (8) | Wifi signal | Red |
Alert entries (red left border, siren icon)
Alerts show: the rule name, a severity badge, and the detection description. If the alert maps to a MITRE ATT&CK technique, the technique ID (e.g., T1558.003) appears as a link to the MITRE ATT&CK website. Hover the technique ID to see the full technique name.
Event entries (blue left border, pulse icon)
Events show: the action name in readable form (e.g., "Kerberos TGT Request"), the outcome (Success or Failure in color), and the target host. These are the underlying telemetry events, automatically deduplicated when a session entry covers the same logon.
Anomaly highlighting
An entry is highlighted with an orange left border and a faint orange background when it falls outside the identity's behavioral baseline:
- The event time is outside the identity's typical hours (e.g., 3am when the identity normally works 9am–5pm)
- The target host is not in the identity's list of typical hosts
Anomaly highlighting requires behavioral data to be available. If the Behavioral Summary Card shows "No behavioral data," anomaly highlighting is inactive.
Session deduplication
When a session entry and a raw event entry cover the same logon (matching timestamp within 10 seconds), the raw event is suppressed. The session entry is the enriched form and provides more detail. This keeps the list readable and avoids showing the same activity twice.
Selecting an Entry
Click any entry to select it. The page layout shifts:
- The timeline list compresses to show only recent entries with scrolling
- A blast radius graph appears showing the identity and its connections to the session target or alert subject
- A detail flyout opens with the full entry data
Session detail
The flyout for a session entry shows: Computer, Logon Type, Auth Package, Source IP, Logon Server, Restricted Admin, Elevated Token, Logon Time, Logoff Time, and Duration.
Click the computer name in the flyout to refocus the blast radius graph on that computer node. This does not navigate away — the timeline stays open.
Alert detail
The flyout for an alert entry shows: Rule name, Severity, Description, MITRE Technique (with a link to the MITRE ATT&CK page), Blast Radius, Event Count, Source Host, and Target Host.
Event detail
The flyout for an event entry shows: Action, Outcome, Target Host, Protocol, and all additional fields from the telemetry event.
Flyout footer actions
Two buttons appear in the flyout footer when an entry is selected:
- View in Graph — Navigates to the Graph Explorer focused on this identity. This is the deliberate exit point for full graph exploration.
- Select Fire (Operator role required) — Opens the Select Fire action modal pre-populated with this identity as the subject. For session entries, the session's target computer is pre-populated as the target. See Select Fire.
Click the selected entry again, or press the close button on the flyout, to deselect and return to the full-list layout.
Select Fire from the Timeline
The Select Fire lightning button is available in the detail flyout footer when you select a timeline entry (Operator role required). Click a session or alert entry to open the detail flyout, then use the Select Fire button at the bottom.
Select Fire pre-populates:
- Subject: The identity shown in the page header
- Operation: Remove access
Clicking the lightning button on an alert entry pre-populates the identity as the subject with the alert context. The Select Fire modal guides you through the preview, simulation, and decision steps. See Select Fire for a full walkthrough.
Access Intelligence
The Access Intelligence panel appears in the detail flyout when you have an entry selected. It compares what this identity is permitted to access against what it is actually accessing based on confirmed telemetry.
Summary grid
Four metrics at a glance:
| Metric | Description |
|---|---|
| Permitted | Count of targets this identity has configured permissions to reach |
| Actual | Count of targets with confirmed session connections (Tier 3 validated) |
| Unused | Permitted targets with no confirmed session activity — candidates for removal |
| Utilization | Percentage of permitted access that is actively used |
The utilization bar beneath the grid is color-coded: green above 80% (most permissions are used), amber 41–80% (partial use), red 40% and below (most permissions are unused).
Permitted vs Actual by type
A horizontal bar chart groups permitted and actual access counts by target type (Computer, Group, Application, etc.). Permitted bars appear in muted gray; confirmed actual bars appear in cyan. The chart makes it easy to spot categories where the identity has many permissions but little or no confirmed activity.
Active Access (Tier 3 Validated)
Lists every target the identity has a confirmed session connection to. Each entry shows the target name, session count, and authentication protocols observed.
Never Accessed (Tier 1 Only)
Lists permitted targets where the permission exists at Tier 1 (theoretical, derived from directory configuration) but the identity has never been observed accessing that target. These are strong candidates for permission removal — the identity has never used this access.
Other Permitted Access
Lists permitted targets that are not in the active set and are at Tier 2 or above — permissions that are more than theoretical but have not generated confirmed sessions recently.
Fidelity badges
Each target in the permitted lists shows a fidelity badge:
| Badge | Meaning |
|---|---|
| T1 (gray) | Theoretical — derived from directory configuration only, never confirmed by telemetry |
| T2 (amber) | Constrained — additional evidence such as a group membership or policy confirms the path |
| T3 (green) | Validated — confirmed by telemetry: the identity has been observed using this access |
Peer comparison callout
When over-permission analytics data is available for this identity's peer group, a callout shows how this identity's permission count compares to peers. For example: "42% more permissions than peers in IT / User / corp.example.com." The link navigates to the Over-Permission Analytics page filtered to this identity.
Acting on unused access
To remove a never-accessed permission:
- Find the target in the Never Accessed (Tier 1 Only) list
- Click the target row to navigate to it in the graph context
- Use the Select Fire button in the flyout footer to initiate a permission removal workflow
A never-accessed permission with Tier 1 fidelity that has never generated a session can be removed with no operational impact.
CSV Export
The Export button in the filter toolbar exports the currently filtered timeline entries to a CSV file. The export includes all entries visible after applying the current time range, type, severity, logon type, and search filters.
Export columns: Timestamp, Type, Description, Severity, Host, Protocol.
The filename uses the identity key as a prefix (e.g., timeline-03086243-cc4e-474c-9087-da2fb6f5ec6b.csv).
Troubleshooting
"No telemetry data" appears for an identity
Cause: The identity has no events, alerts, or sessions in any time range, and no behavioral profile has been computed.
Solution:
- Confirm that telemetry is flowing for this identity's domain. Check Analysis > Risk Posture and verify that event ingestion counters are increasing.
- Confirm that the identity has logged on recently. Check the
lastActivityfield in any identity detail panel — if it is blank or very old, the account may be inactive. - If the identity is active but shows no data, verify that the domain name in telemetry events matches the domain of the identity node (FQDN format, not NETBIOS). See Telemetry Pipeline.
"No events in the selected date range" appears
Cause: Events exist but none fall within the selected time window.
Solution: Expand the date range. Try 90 days or a custom range covering the period of interest. If no events appear at any range, see the "No telemetry data" steps above.
"No events match your filters" appears
Cause: Events exist in the selected time range but the active type, severity, logon type, or search filters exclude all of them.
Solution: Clear individual filters using the filter controls. Reset to defaults by removing query parameters from the URL.
Alerts are not showing for an identity I know was targeted
Cause: Detection alerts are correlated to identity nodes by matching the subject name in the alert to the identity's sAMAccountName. If the alert was generated using a DOMAIN\User format and the identity node stores only the short account name, the correlation fails.
Solution:
- Navigate to Analysis > Detection Alerts directly and search for the identity name
- If the alert appears there but not in the timeline, this is a name format mismatch — check that the OTel Collector is normalizing subject names to
sAMAccountNameformat before ingestion. See Telemetry Pipeline.
Sessions are missing computer names
Cause: The workstationName field in the original Windows event was blank. This can happen for Kerberos network logons originating from applications rather than workstations.
Solution: This is expected behavior for some logon types. The source IP is still captured and visible in the session detail flyout. You can use the source IP to identify the originating host manually.
Behavioral summary shows "No behavioral data" after a full sync
Cause: The post-sync analytics pipeline may not have completed yet, or the identity has fewer than 5 events in the last 30 days.
Solution:
- Wait a few minutes after a full sync completes — the behavioral analytics pipeline runs after the graph topology is written
- Verify that the identity has at least 5 events in the last 30 days (check the 30-Day Events count on any nearby identity that does have data)
- Delta syncs do not trigger behavioral recomputation — you must run a full sync