Identity Inventory
A unified, table-first investigation surface for every identity in your environment — with composite risk scoring, permission intelligence, membership analysis, and integrated graph visualization.
Requires role: Operator+
Related: Risk Posture Dashboard, Graph Explorer, Over-Permission Analytics, Stale Identity Detection, Select Fire, Critical Junctions, Delegation Posture, Multi-Agent Intelligence, Detection Alerts
Overview
The Identity Inventory is the primary investigation surface in the platform. Instead of navigating between separate analysis pages for stale accounts, over-permissions, membership, and graph exploration, the Inventory presents every identity in a single sortable, filterable table with pre-computed metrics — and lets you pivot into graph visualization without leaving the page.
Key capabilities:
- Composite Risk Score (0-100) combining 8 orthogonal factors — sort by risk to find your highest-priority identities instantly
- Filter presets that surface focused analysis views ("Stale", "Over-Permissioned", "Tier 0") as filtered subsets of the same table, each with a count badge showing matching identities
- Permission intelligence — explicit vs. delegated (inherited) permission breakdown with 4-tier ACE origin classification and inheritance tracing back to source containers
- Bidirectional relationships and permissions — separate inbound/outbound metrics with clickable graph views (6 graph types total)
- Table-graph interaction — click any In/Out count to open an inline graph panel; tap aggregate nodes to filter the table by type
- AdminSDHolder awareness — protected identity badges, stale AdminCount detection, SDProp divergence alerts
- CSV export — download the current filtered view for offline analysis or reporting
All metrics are pre-computed after each sync and cached per domain. The Inventory loads instantly regardless of environment size.
Prerequisites
- Role: Operator or Admin
- Data: At least one successful identity sync from an LDAP bridge or Entra ID provider
- Worker: The background worker must be running to compute criticality, junction scores, and risk factors
- Analytics cache: Risk scores and permission statistics are computed during the post-sync analytics pipeline. If analytics haven't run yet, some columns may show placeholder values
Accessing the Identity Inventory
Navigate to Analysis > Identity Inventory in the left sidebar. The page loads with the Users tab selected and identities sorted by Risk Score descending.
Note: Sidebar links for Stale Identities and Over-Permission navigate to their own standalone analysis pages, not to the Inventory. Similarly, Risk Posture Dashboard component cards link to their respective standalone pages. The Inventory is accessed directly via Analysis > Identity Inventory in the sidebar.
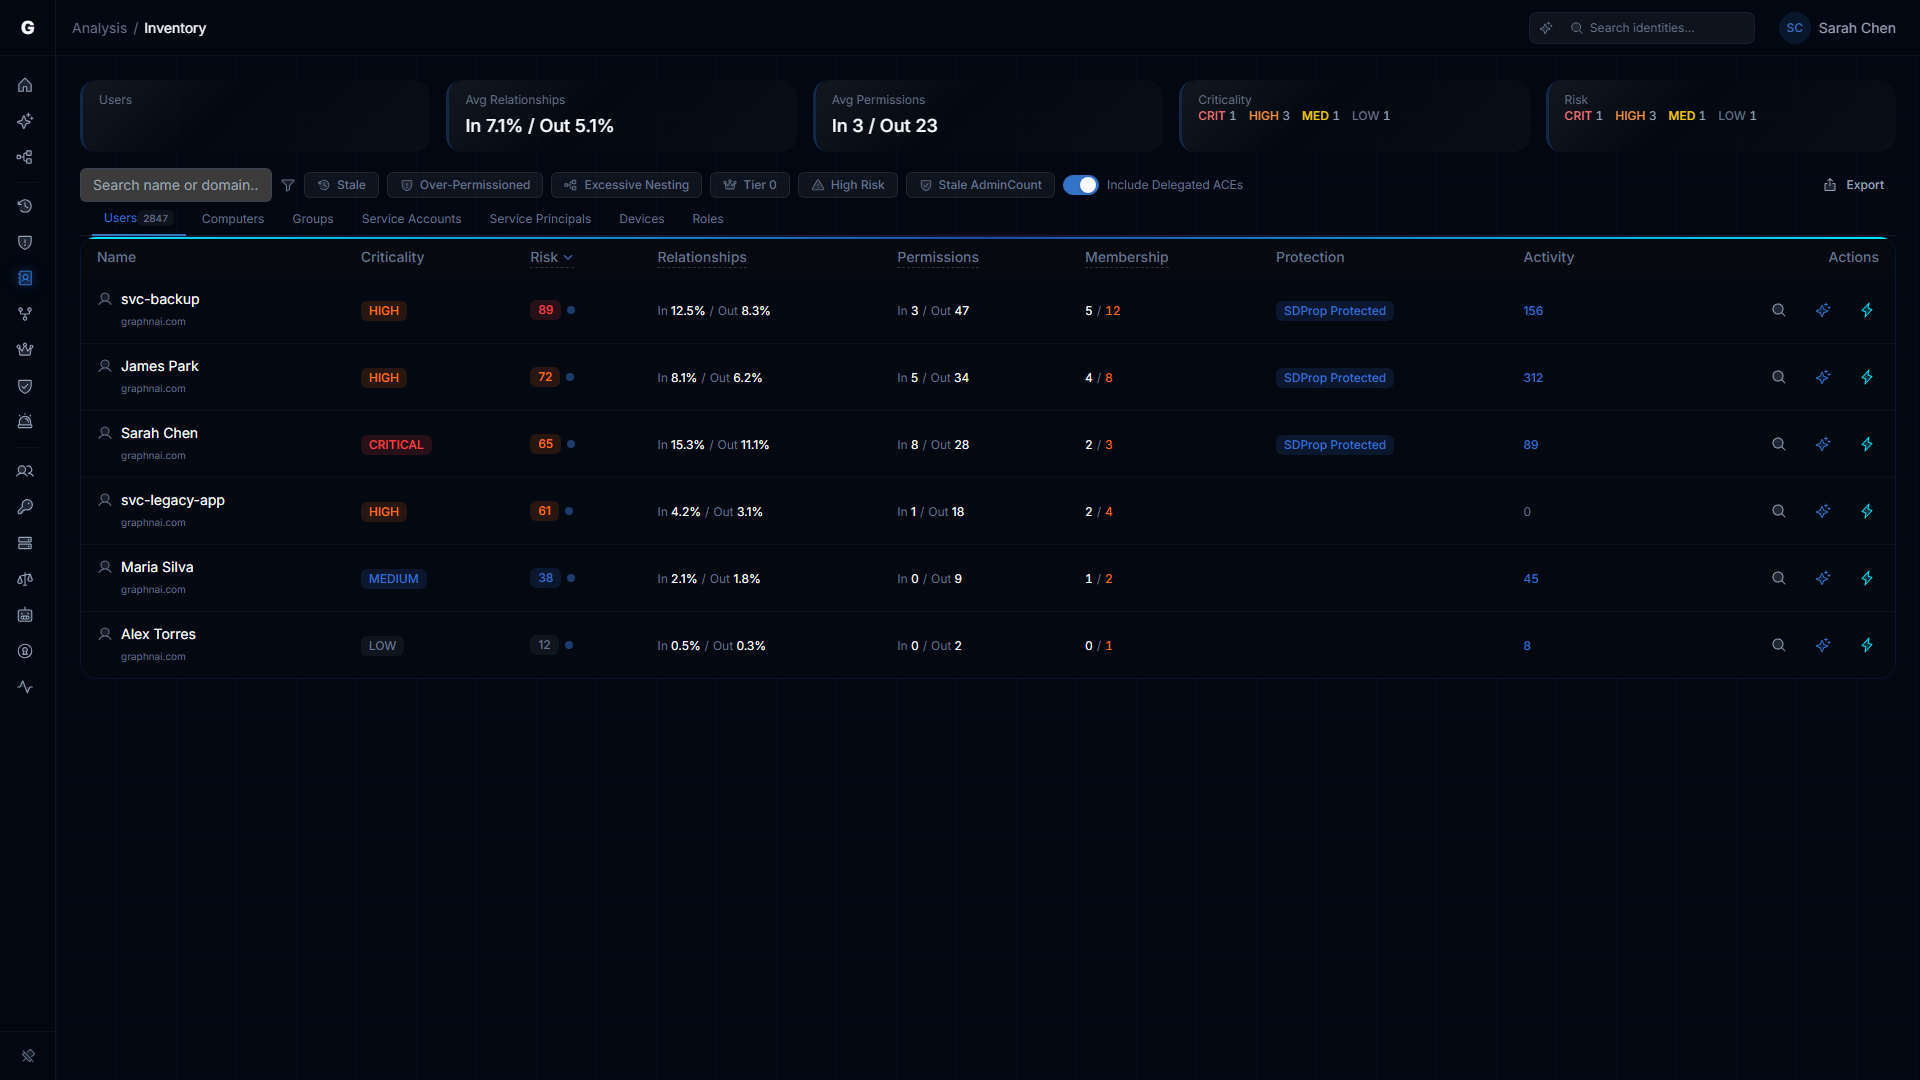
The Identity Table
Type Tabs
Tabs across the top filter by identity type. The default tab is Users. Tab labels are plural:
| Tab | Identity Types Shown |
|---|---|
| Users | Human accounts |
| Computers | Domain-joined machines |
| Groups | Security and distribution groups |
| Service Accounts | On-premises service accounts |
| Service Principals | Entra ID application identities |
| Devices | Mobile and IoT devices |
| Roles | Azure AD / application roles |
Each tab shows a count badge indicating the number of identities of that type. When a graph filter is active (see Table-Graph Interaction), the badge updates to reflect the filtered set.
Summary Cards
Below the type tabs, five summary cards provide at-a-glance metrics for the selected type:
| Card | Description |
|---|---|
| Total / Type Count | Number of identities of the selected type. When a filter preset or graph filter is active, shows "X of Y" (filtered count vs. total). The label reflects the active filter and type (e.g., "Stale Users"). |
| Avg Relationships | Average inbound and outbound relationship percentages across all identities, formatted as "In X.X% / Out Y.Y%". |
| Avg Permissions | Average inbound and outbound permission counts, formatted as "In X / Out Y". |
| Criticality | Breakdown by asset criticality level: CRIT, HIGH, MED, LOW — each with a count and color-coded label. |
| Risk | Breakdown by risk level: CRIT, HIGH, MED, LOW — each with a count and color-coded label. |
Table Columns
| Column | Description |
|---|---|
| Name / Domain | Display name with domain shown below. Type icon indicates the identity type. Click to open the identity detail flyout. |
| Criticality | Asset criticality level (CRITICAL, HIGH, MEDIUM, LOW) with color-coded badge. |
| Risk | Composite risk score (0-100) with color-coded level badge. Click to expand the risk factor breakdown with fidelity confidence indicator. |
| Relationships | Shows "In X.X% / Out Y.Y%" — the identity's inbound and outbound relationship connectivity as a percentage of the domain. In and Out are separate clickable links that each open a different graph view (BlastRadiusGraph inbound or outbound). |
| Permissions | Shows "In X / Out Y" — inbound and outbound effective permission counts. In and Out are separate clickable links that each open a different graph view (PermissionGraph inbound or outbound). When "Include Delegated ACEs" is toggled off, the Out count shows only direct (explicit) permissions. |
| Membership | Direct / Indirect group membership counts. Click to open the outbound MembershipGraph. Shown for Users, Computers, Groups, and Service Accounts. Indirect count is highlighted in orange when non-zero. |
| Members | Direct / Indirect inbound member counts. Click to open the inbound MembershipGraph. Shown for Groups only. Empty groups show a warning icon. Stale empty groups (>180 days) show a clock icon in red. |
| Protection | Shows "SDProp Protected" badge for AdminSDHolder-protected identities, or "Stale AdminCount" warning badge for identities with orphaned adminCount=1. |
| Activity | Total activity event count (sessions + alerts + events combined), fetched in a separate batch for the visible page. Active identities show the count in blue; inactive identities show a muted count. Shown for Users, Computers, Service Accounts, Service Principals, and Devices. |
| Actions | Quick action buttons (see Actions below). |
Conditional Columns
Additional columns appear when specific filter presets are active:
| Column | Visible When | Description |
|---|---|---|
| Stale For | stale preset active | Days since last activity, formatted as days (e.g., "127d") or years/months for long durations (e.g., "2y 3m"). Orange text for values over 90 days. |
| Deviation | over-permissioned preset active | How far this identity's permission count exceeds its peer group average. Higher values indicate greater excess. Values above 3.0 are highlighted in orange. |
| Depth | excessive-nesting preset active | MemberOf chain nesting depth. Values above 5 are highlighted in orange. |
| Divergent | stale-admincount preset active | Number of ACEs that diverge from the AdminSDHolder template. Non-zero values are highlighted in amber. |
Actions
Each row has three action buttons:
| Action | Icon | Description |
|---|---|---|
| Investigate in Graph | Magnifying glass | Opens the Graph Explorer focused on this identity |
| Explain with Graphne | Sparkle (blue) | Opens the AI explanation dialog for this identity's risk posture (Operator+ only, requires AI provider configuration) |
| Select Fire | Lightning (cyan) | Opens the Select Fire remediation workflow for this identity (Operator+ only) |
Search & Filtering
Text search: Type in the search bar above the table to filter by display name, SAM account name, or domain. Debounced with a 300ms delay. The URL updates to include the search term (e.g., ?q=john).
Domain filter: When multiple domains are present, a dropdown appears to restrict results to a specific AD domain or Entra tenant.
Include Delegated ACEs toggle: Controls whether the outbound Permissions count includes delegated (inherited) permissions or only explicit permissions. Default is ON. The toggle does not affect the risk score — it always considers the full effective permission set.
CSV Export: Click the export button to download the current filtered view as a CSV file.
Filter Presets
Predefined filter presets appear as a horizontal button bar above the table. Each preset shows a count badge with the number of matching identities (server-computed from the full analytics cache, not limited to the current page). Clicking a preset toggles it; clicking it again (or clicking the "Clear" button with X icon) removes the filter.
| Preset Label | URL Parameter | What It Shows |
|---|---|---|
| Stale | stale | Identities beyond their type-specific staleness threshold. Adds the "Stale For" column. |
| Over-Permissioned | over-permissioned | Identities exceeding peer-group permission baseline (deviation threshold > 2.0). Adds the "Sigma" column. |
| Excessive Nesting | excessive-nesting | Identities with group nesting depth exceeding threshold. Adds the "Depth" column. Hidden when the active type tab does not support membership. |
| Empty Groups | empty-groups | Groups with zero direct and indirect members. Hidden when the active type tab is not Groups. |
| Tier 0 | tier0-exposed | Identities with Tier 0 classification (direct or indirect Tier 0 access). |
| High Risk | high-risk | All identities with risk level Critical or High. |
| Stale AdminCount | stale-admincount | Identities with orphaned adminCount=1 flag (no longer members of any protected group). Adds the "Divergent" column. |
The URL updates to include the filter parameter (e.g., ?filter=stale), making filtered views bookmarkable and shareable.
Risk Prioritization
Composite Risk Score
Every identity receives a composite risk score from 0 (no risk) to 100 (critical risk), combining 8 orthogonal factors:
| Factor | Description |
|---|---|
| Permission Load | Severity-weighted effective permission count |
| Criticality Gap | Mismatch between identity's criticality and its targets' criticality |
| Junction Score | Critical junction score from betweenness centrality analysis |
| Staleness | Days beyond the type-specific staleness threshold |
| Tier 0 Exposure | Whether this identity has direct or indirect access to Tier 0 assets |
| Alert Severity | Maximum severity of detection alerts |
| Group Hygiene | For groups: whether the group has zero members, or excessive nesting depth |
The default table sort is Risk descending, so the identities most in need of attention appear at the top.
Risk Factor Breakdown
Click any risk score badge to expand a risk factor breakdown showing:
- Each factor's individual contribution (0-100 scale)
- The weighted contribution to the composite score
- A visual bar for quick comparison
- Fidelity Confidence indicator (High / Medium / Low)
This helps you understand why an identity is high-risk — whether it's driven by excessive permissions, staleness, Tier 0 proximity, or a combination.
Fidelity Confidence
Each identity shows a Fidelity Confidence indicator:
| Level | Meaning |
|---|---|
| High | Most access edges are Tier 2 (Constrained) or Tier 3 (Validated) — risk score is reliable |
| Medium | Mix of Tier 1 (Theoretical) and higher-tier edges — risk score is directionally accurate |
| Low | Primarily Tier 1 (Theoretical) edges — risk score may overstate actual exposure |
Low-confidence identities may warrant a sync refresh or telemetry enrichment to improve data quality before acting on the risk score.
Permission Intelligence
Effective vs. Delegated Permissions
The platform classifies every ACE (Access Control Entry) into a 4-tier origin taxonomy:
| Origin | Description | Typical Source |
|---|---|---|
| Explicit | ACE applied directly to the object's security descriptor | Manual permission grants, tool-based provisioning |
| Inherited-Custom (Delegated) | Inherited ACE from a non-well-known trustee | Custom OU delegations, Group Policy preferences, admin-configured delegation |
| Inherited-Structural | Inherited ACE from a well-known system trustee | Built-in AD trustees like SELF, ENTERPRISE DOMAIN CONTROLLERS, Schema/Domain Admins |
| Inherited-Default | Inherited ACE matching the schema default security descriptor | Matches AD schema defaults (noise) |
The platform automatically filters inherited-structural and inherited-default ACEs from permission counts. This reduces noise by 30-70% and ensures that permission analytics reflect actionable access, not AD infrastructure plumbing.
Explicit and inherited-custom ACEs are always counted — these represent security-relevant access that was deliberately configured, whether directly on the object or via custom container delegation.
Include Delegated ACEs Toggle
The Include Delegated ACEs toggle above the table switches between two permission views:
- ON (default): Shows total effective permission count including delegated (inherited-custom) permissions in the outbound Permissions count
- OFF: Shows only direct (explicit) permissions — useful for identifying what was deliberately granted vs. what flows from container delegation
When toggled off, the outbound Permissions count updates to show only explicit permission counts. The Risk score is not affected — it always considers the full effective permission set.
Inheritance Tracing
When you inspect a delegated permission edge in the graph or edge detail panel, the platform shows the source container where the ACE originates. For example:
Inherited from: OU=Service Accounts,DC=corp,DC=example,DC=com
Click the source container name to navigate to it in the graph and inspect the delegation at its source. This is critical for remediation — modifying an inherited ACE requires changing the DACL on the source container, not on the individual object.
AdminSDHolder Protection
Identities protected by Active Directory's AdminSDHolder mechanism (members of privileged groups like Domain Admins, Enterprise Admins, Account Operators, etc.) display a SDProp Protected badge in the Protection column.
Why this matters: The Security Descriptor Propagation (SDProp) process resets protected objects' ACLs to match the AdminSDHolder template every ~60 minutes. This means:
- Explicit ACE modifications on protected objects are overwritten — remediation attempts will be undone automatically
- Divergent ACEs (ACEs on a protected object that don't match the AdminSDHolder template) may indicate tampering or misconfiguration
The Inventory shows:
- SDProp Protected badge on protected identities (Protection column)
- Stale AdminCount warning badge — identities with
adminCount=1that are no longer members of any protected group (orphaned protection flag) - Divergent ACE count — visible as a conditional column when the Stale AdminCount filter preset is active
Use the Stale AdminCount filter preset to find orphaned objects. These identities retain the restrictive AdminSDHolder security descriptor even though they no longer need it, which can cause access issues or mask security problems.
Membership Analysis
Outbound: Member Of
Click the Membership count for any identity to open a membership graph showing the outbound MemberOf chain. The graph renders as a tree, with the selected identity at the root and parent groups branching upward.
This view helps you understand:
- How deep the group nesting goes
- Whether unexpected parent groups grant unintended access
- The full chain from a user to a sensitive group (e.g., User -> IT Staff -> Server Admins -> Domain Admins)
Inbound: Members
Click the Members count for any group to open the inbound members graph. The MembershipGraph component uses a direction toggle (outbound for Member Of, inbound for Members).
The inbound view uses hybrid rendering:
- Group nodes are rendered individually (they're structurally important)
- Non-group members are aggregated by type (e.g., "Users (47)", "Computers (12)") to avoid visual overload
Click an aggregate node to expand it into a filterable member list. This is essential for understanding the blast radius of group-level permission changes.
Empty & Stale Empty Groups
Groups with zero direct and indirect members show an Empty Group icon (orange warning diamond) in the Members column.
Groups that are both empty and haven't been modified in over 180 days show a Stale Empty icon (red clock). These are strong candidates for cleanup — they may represent abandoned delegation targets that still have standing permissions on OUs or containers.
Table-Graph Interaction
The Inventory supports bidirectional interaction between the table and inline graph visualizations.
Clickable Counts
Numeric values in the Relationships, Permissions, Membership, and Members columns are clickable. The In and Out values in Relationships and Permissions are separate clickable links, each opening a distinct graph view. There are 6 graph view types in total:
| Click Target | Graph View Key | Graph Component | Direction |
|---|---|---|---|
| Relationships: In | relationships-in | BlastRadiusGraph | Inbound |
| Relationships: Out | relationships-out | BlastRadiusGraph | Outbound |
| Permissions: In | permissions-in | PermissionGraph | Inbound |
| Permissions: Out | permissions-out | PermissionGraph | Outbound |
| Membership | membership | MembershipGraph | Outbound |
| Members | members | MembershipGraph | Inbound |
Counts of zero are displayed as static text, not clickable links.
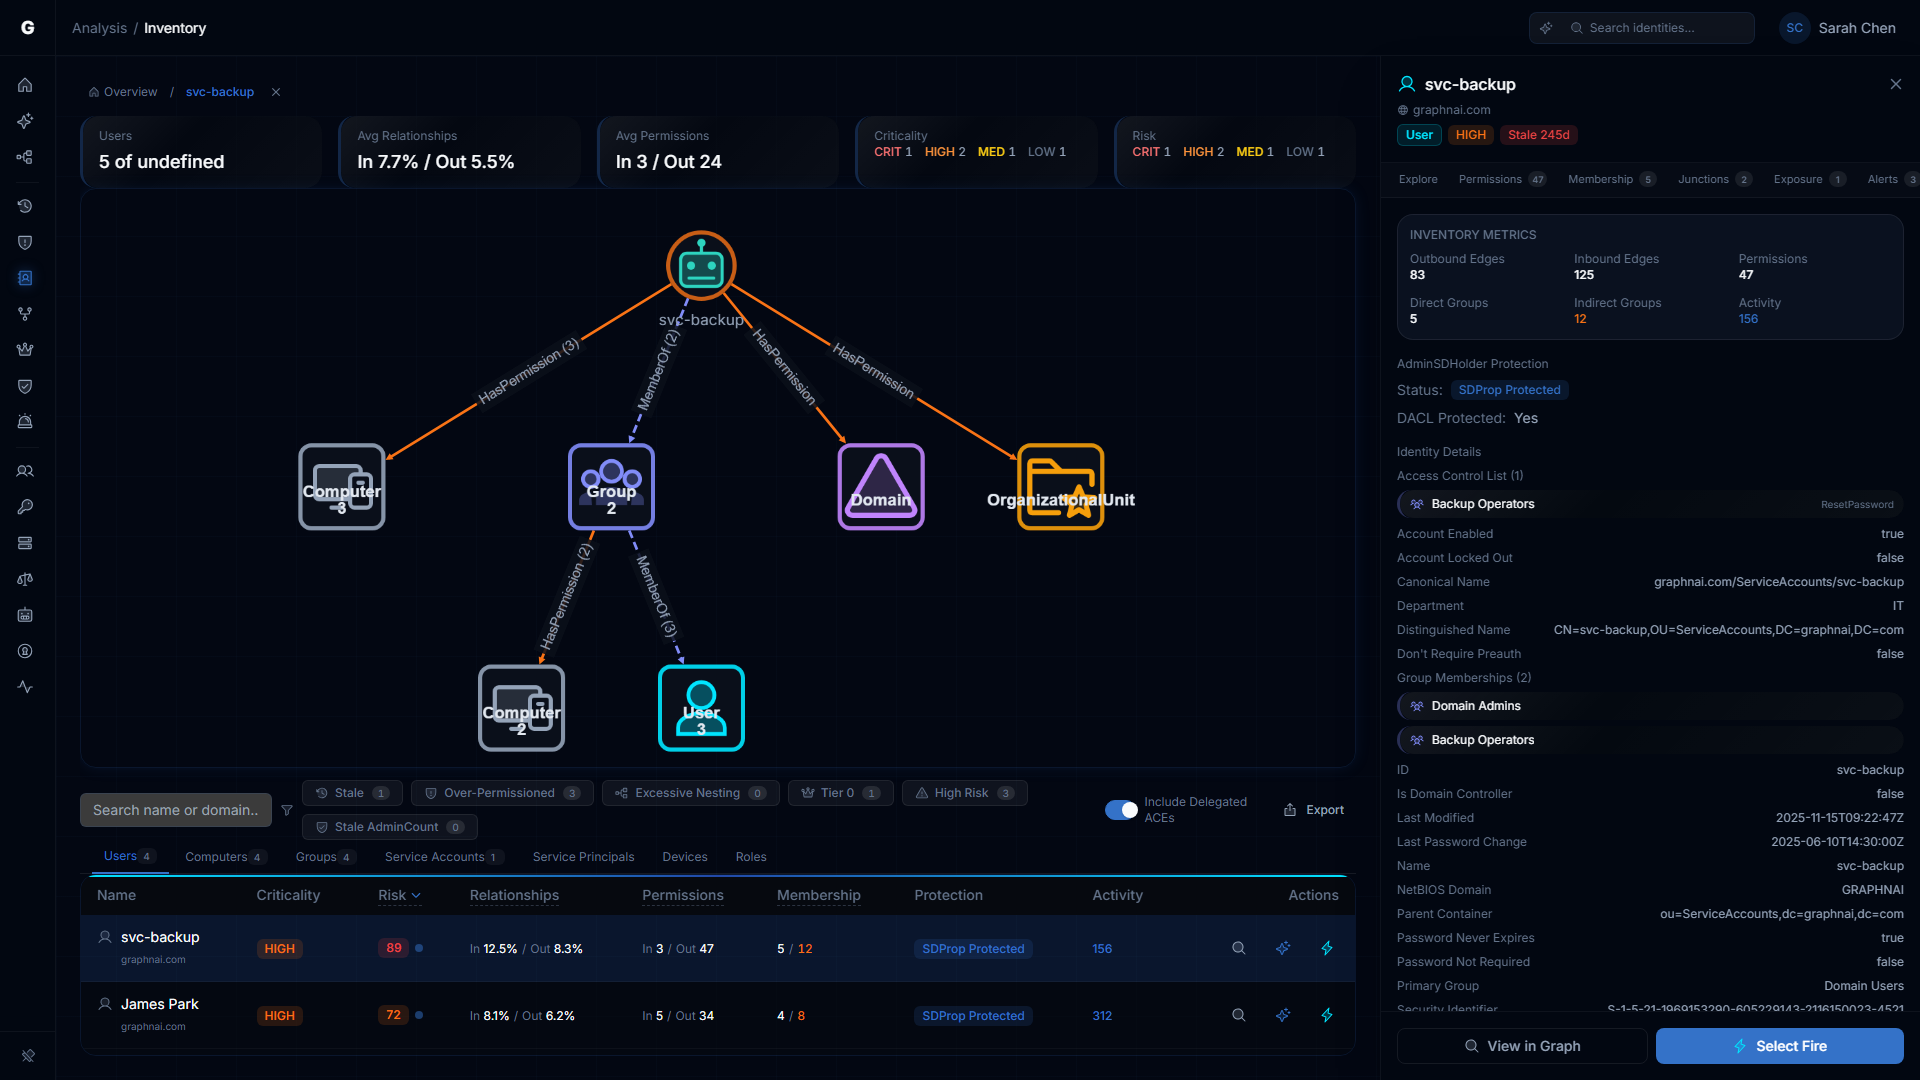
Graph Panel
The graph panel appears above the table in a split layout (the table compresses to ~180px height). You can:
- Pan and zoom the graph using scroll wheel and drag
- Tap aggregate nodes in BlastRadius/Permission graphs to filter the table by that type (auto-switches the type tab if needed)
- Click edges to open the edge detail panel showing permission names, fidelity tier, and ACE origin
- Click table rows while a graph is open to re-focus the graph on that identity
Breadcrumb Navigation
As you drill through the graph, a breadcrumb trail (FocusBreadcrumbs) tracks your investigation path:
Inventory > john.doe > Domain Admins > Server OperatorsClick any breadcrumb to jump back to that point in the investigation. Click "Inventory" to close the graph panel and return to the full table.
URL Sharing
All graph state is encoded in URL parameters (graphView, graphFocus, drillType), making your current investigation state bookmarkable and shareable. Send a URL to a colleague and they'll see exactly the same view you're looking at.
Membership Page
The Membership page provides a dedicated view of group membership depth across all identities. Access it via the FlyoutNavigationTabs "Membership" tab when investigating a specific identity.
Table Columns
| Column | Description |
|---|---|
| Identity | Display name with type icon |
| Type | Identity type (User, Computer, Group) |
| Direct | Count of direct (first-hop) group memberships |
| Indirect | Count of indirect (transitive) group memberships, highlighted in orange when non-zero |
| Total | Total group memberships (direct + indirect) |
| Max Depth | Maximum nesting depth in the MemberOf chain, highlighted in orange when > 5 |
| Criticality | Asset criticality level badge |
| Domain | Domain name |
Summary Cards
Three summary cards at the top:
- Identities with Groups — total count of identities with any group membership
- Avg Direct Groups — average number of direct group memberships
- Max Nesting Depth — highest nesting depth found (warning variant when > 5)
Filters
- Type dropdown — filter by User, Computer, or Group
- Domain dropdown — filter by domain (appears when multiple domains exist)
Graph Integration
Selecting a row opens the MembershipGraph visualization above the table, with direction determined by type (outbound for Users/Computers, inbound for Groups). The FindingDetailFlyout opens on the right with FlyoutNavigationTabs for cross-page investigation.
Delegation Posture (Separate Page)
The Delegation Posture analysis is a separate page accessible via Analysis > Delegation Posture in the left sidebar. It is not part of the Identity Inventory.
The delegation engine evaluates custom OU/container delegations against Microsoft best practices. Key capabilities include:
- Delegation Source Detection — identifies containers and OUs where custom delegations have been configured by grouping inherited-custom ACEs by their source container
- 5-Factor Scoring — each delegation source receives a score (0-100) based on breadth, depth, severity, scoping quality, and trustee health
- 6 Best Practice Conformance Rules — scoped delegation, group-based trustees, restricted dangerous permissions, AdminSDHolder avoidance, and plane isolation
- Cross-Plane Detection — delegations crossing Enterprise Access Model plane boundaries receive elevated risk scoring
Risk Posture Integration
Domain-level delegation risk is aggregated and surfaced on the Risk Posture Dashboard as the "Delegation Risk" component card.
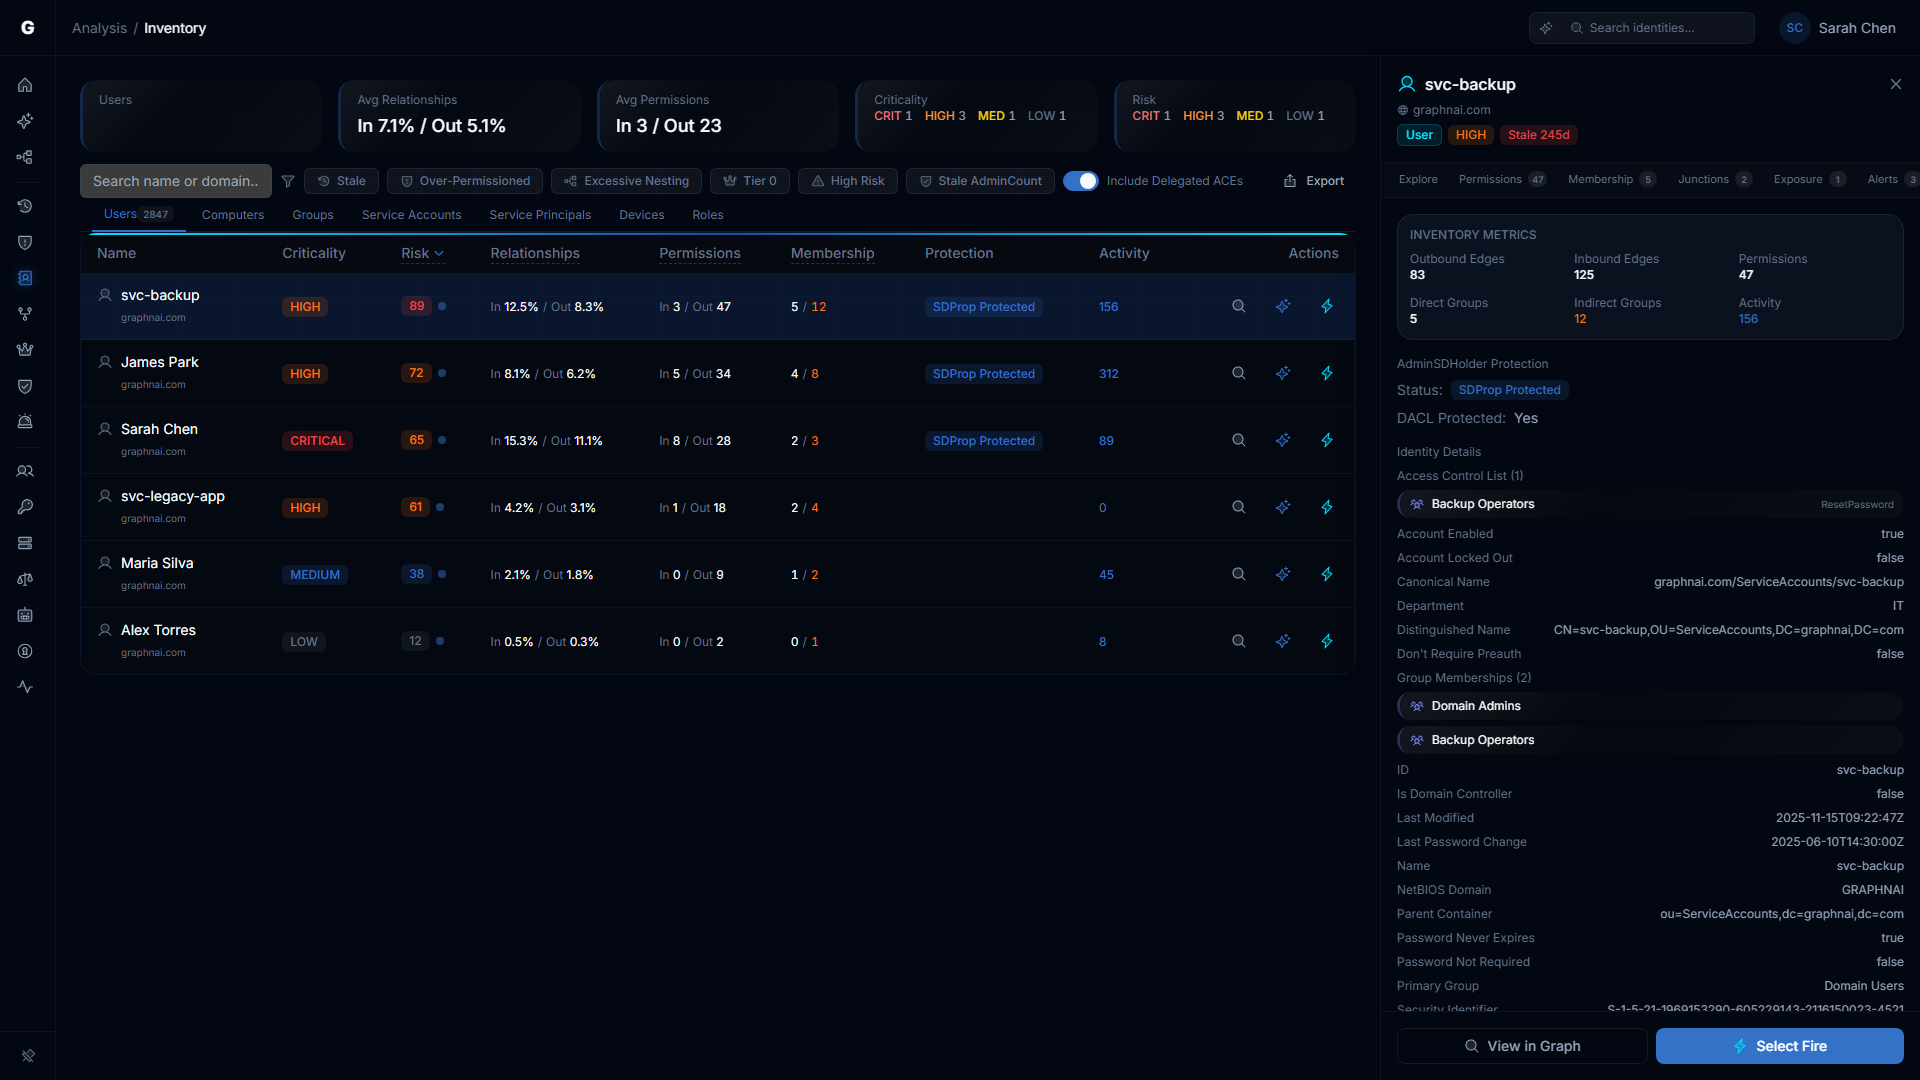
Identity Detail Flyout
Click any identity name in the table to open the FindingDetailFlyout on the right side of the page. The flyout shows:
- Identity header — Type icon, display name, domain, criticality badge, tier indicator
- FlyoutNavigationTabs — Investigation tabs that navigate across analysis pages while maintaining identity focus: Explore (Graph), Permissions (Over-Permission), Membership, Junctions, Exposure (Tier 0), Alerts (Detection), Timeline. Tab visibility depends on the identity type (e.g., Exposure only for Users, Membership only for Users/Computers/Groups). Each tab shows a count badge from the investigation summary.
- Risk Score with full factor breakdown (via RiskBadge component)
- Properties — All synced directory attributes (SAM account name, UPN, department, title, etc.)
- Staleness — Days since last activity when available
- Inventory Metrics section — compact grid showing: Outbound Edges, Inbound Edges, Permissions, Direct Groups, Indirect Groups (highlighted orange if > 0), Members (for Groups), Activity count (blue if active)
- AdminSDHolder Protection section (when applicable) — Protection status badge (SDProp Protected or Stale AdminCount), DACL Protected indicator, Divergent ACEs count with amber highlight, remediation guidance for stale AdminCount objects
- Permission Summary — Explicit/delegated/total counts with expandable ACL list
Flyout Actions
The flyout footer provides action buttons based on your role:
- Navigate to Graph — opens the Graph Explorer focused on this identity
- Select Fire — opens the remediation workflow (Operator+ only)
Additionally, the Explain with Graphne action is available via the row-level action buttons in the table.
Troubleshooting
Risk scores are all zero
Cause: The post-sync analytics pipeline hasn't run yet, or the worker isn't running.
Solution:
- Check that the worker process is running (verify via your deployment's process manager or container orchestrator)
- Trigger a sync — analytics run automatically after each full sync
- Check server logs for "Post-sync analytics completed" messages
Permission counts seem too high
Cause: Delegated (inherited-custom) permissions from broad container delegations inflate counts.
Solution:
- Toggle Include Delegated ACEs to OFF to see only explicit permissions
- Review the In/Out split — high inbound permissions indicate this identity is a target of many grants
- Use Inheritance Tracing to identify the source containers responsible for the inherited permissions
- Review delegation quality on the Delegation Posture page
"Stale AdminCount" badge appears on active, legitimate accounts
Cause: The identity was previously a member of a protected group (e.g., Domain Admins) and was removed, but the adminCount=1 flag was never cleared. This is a known AD behavior — SDProp sets adminCount=1 but never clears it.
Solution:
- Verify the identity is no longer a member of any protected group by checking its membership chain
- Manually clear
adminCountin Active Directory (set to 0 or remove the attribute) - Consider re-applying security descriptor inheritance on the object since SDProp disabled it
Graph panel doesn't open when clicking a count
Cause: The count is zero — there's nothing to visualize.
Solution: Counts of zero are displayed as static text, not clickable links. This is expected behavior.
Filter preset shows different results than the standalone page
Cause: The Identity Inventory filter presets use the same underlying data but may apply slightly different presentation logic. For example, the Inventory's "Over-Permissioned" preset uses a default deviation threshold of 2.0, while the standalone Over-Permission Analytics page allows slider adjustment.
Solution: For fine-grained control over detection sensitivity (deviation threshold threshold, minimum peer group size), use the standalone Over-Permission Analytics page. For quick triage, the Inventory preset is sufficient.
CSV export is slow or times out
Cause: Exporting a very large filtered set (100,000+ identities) with all columns.
Solution:
- Apply filters to reduce the export set (type filter, domain filter, filter presets)
- If you need a full export, use the CSV export feature with no filters applied and limit set to zero
Best Practices
- Start with Risk descending — The default sort surfaces the highest-priority identities. Work through the first page before applying filters.
- Use filter presets for focused audits — Instead of building complex filter combinations, use the preset that matches your audit objective (quarterly stale review, access review, Tier 0 check).
- Investigate with the graph, decide in the table — Click In/Out counts to understand the visual topology, then return to the table to compare identities and prioritize remediation.
- Check delegation posture after delegation changes — After modifying OU permissions, trigger a sync and review the delegation score on the Delegation Posture page to confirm the change improved (or didn't worsen) your posture.
- Clean up stale AdminCount — Orphaned
adminCount=1flags are a common AD hygiene issue. Use the "Stale AdminCount" filter preset to find and remediate these systematically. - Review fidelity confidence before acting — Low-confidence risk scores may overstate exposure. Consider enriching with telemetry data (see Telemetry Enrichment) before making remediation decisions.
- Share investigations via URL — The URL encodes your entire investigation state (tab, filters, graph focus, drill path). Send URLs to colleagues instead of describing what you're looking at.
- Use FlyoutNavigationTabs to pivot — When investigating a specific identity, use the flyout tab bar to jump between Permissions, Membership, Junctions, and other analysis pages while maintaining context.
Related Features
- Risk Posture Dashboard — Executive-level composite risk score with trend tracking (includes Delegation Risk component)
- Graph Explorer — Full-screen graph visualization for ad-hoc exploration
- Over-Permission Analytics — Detailed peer-group analysis with adjustable detection sensitivity
- Stale Identity Detection — Detailed stale account analysis with custom thresholds
- Select Fire — Simulate and execute permission changes from Inventory findings
- Critical Junctions — High-leverage accounts bridging privilege tiers
- Telemetry Enrichment — Improve fidelity confidence with session and privilege telemetry
- Delegation Posture — OU/container delegation scoring against Microsoft best practices