Telemetry Pipeline
Ingest real-time authentication and security events to validate access paths and power threat detection.
Requires role: Operator (viewing pipeline status), Admin (Bridge provisioning and configuration)
Related: Identity Bridge, Risk Posture Dashboard, Asset Criticality, ITDR Detection, Detection Alerts, Telemetry Enrichment, Graph Explorer
Overview
The identity graph built by syncing Active Directory and Entra ID tells you what access could happen — who is a member of which groups, what permissions are configured on which objects. This is Tiered Fidelity™ Tier 1 (Theoretical) and Tier 2 (Constrained) data: structurally accurate but unconfirmed by real activity.
The Telemetry Pipeline bridges that gap. By ingesting live authentication events and security logs from your Windows domain controllers, the platform can confirm which access paths are actually being used and promote those edges to Tier 3 (Validated). Tier 3 edges represent real, observed sessions — a user who authenticated to a server, a group membership confirmed by a Kerberos ticket, a privileged logon that left an audit trail.
Once telemetry is flowing, the platform gains two additional capabilities:
- Validated access paths: Edges promoted to Tier 3 are surfaced with higher confidence in path analysis and risk scoring, helping you focus on real attack surface rather than theoretical paths.
- Real-time threat detection: The ITDR detection engine evaluates incoming events against detection rules (Kerberoasting patterns, DCSync attempts, unusual privilege escalation) and produces alerts that appear in the Risk Posture Dashboard.
Events are stored for 90 days in a forensic event log, giving analysts a searchable record of authentication activity correlated to identities in the graph.
Prerequisites
- Identity Bridge deployed and connected: At least one Bridge must be running and have completed a full sync. The Bridge provides the mTLS certificates used to authenticate telemetry submissions. See the Identity Bridge guide.
- Event collection mechanism deployed: Either an OpenTelemetry Collector on your domain controllers (recommended — see Method 2), or a custom log shipper forwarding events via the REST endpoint. The Bridge itself does not yet collect event logs directly (planned — will require the Bridge sync account to be a member of the Event Log Readers group on DCs).
- Windows Audit Policy configured: Your domain controllers must be configured to generate the relevant Security Event Log entries. See Configuring Windows Audit Policy below.
- Operator or Admin role: Viewing telemetry-related data in the graph requires Operator role. Configuring ingestion endpoints and the Bridge requires Admin role.
Ingestion Methods
The platform supports three ways to forward telemetry today, with a fourth planned. You can use one or all simultaneously — all events flow through the same normalization and graph action pipeline regardless of how they arrive.
Method 1: Identity Bridge (Planned)
Planned — This capability is not yet implemented.
The Identity Bridge can be extended to read Windows Security Event Logs remotely from domain controllers over the same connection it uses for LDAP and SMB. This requires adding the Bridge's sync account to the Event Log Readers group on your DCs. Once implemented, this will be the simplest option — no additional infrastructure beyond the existing Bridge deployment.
Until this is available, use the OTel Collector Sidecar (Method 2) or REST endpoint (Method 3) to forward events.
Method 2: OpenTelemetry Collector (Recommended — BYOT)
Deploy an OpenTelemetry Collector on each domain controller (or a Windows Server with access to DC event logs via Windows Event Forwarding). The platform can auto-generate the Collector configuration for you — see Auto-Generated Config below.
The Collector reads the Security Event Log locally, batches the events, and ships them to the platform's OTLP endpoint using the Bridge's mTLS certificates for authentication. This is the recommended approach because:
- Bring Your Own Telemetry (BYOT): If you already run an OTel-compatible collector in your environment, you don't need to install anything new — just add the generated GraphnAI pipeline config to your existing deployment
- It filters events at the source, sending only the security-relevant Event IDs
- It uses the standard OpenTelemetry Protocol, compatible with existing observability infrastructure
- Retry and backpressure are handled automatically
Compatible collectors: The generated config is standard OTel Collector YAML. It works with any collector that uses the OTel YAML configuration format and includes the windowseventlog receiver. The config defines its own named pipeline, so it runs alongside your existing pipelines without interference — your collector continues shipping data to its original destination while simultaneously forwarding security events to GraphnAI.
| Distribution | Vendor | Code-Signed | Config Compatible | Notes |
|---|---|---|---|---|
| Splunk Distribution of OTel Collector | Splunk | Yes | Yes — standard OTel YAML | Add our config as an additional pipeline alongside existing Splunk pipelines |
| OpenTelemetry Collector Contrib | CNCF | No | Yes — standard OTel YAML | Upstream community build; unsigned binary triggers SmartScreen on Windows |
Note on other collectors: Some OTel-compatible collectors use proprietary configuration formats that differ from standard OTel YAML. For example, Grafana Alloy uses its own configuration syntax (not YAML), and Elastic Agent is managed through Fleet/Kibana. These collectors cannot use the generated config directly. If you run one of these, you have two options:
- Translate the generated config into your collector's native format (refer to your vendor's OTel compatibility documentation)
- Deploy a separate Splunk OTel Collector instance dedicated to GraphnAI telemetry
See the OpenTelemetry Collector Distributions page for the full list of distributions.
Tip: If you don't have an existing collector and need to install one on a domain controller, use the Splunk Distribution of OTel Collector — it is code-signed, uses standard OTel YAML config, and supports multiple pipelines out of the box. The upstream
otelcol-contribbinary is functionally identical but unsigned, which triggers Microsoft Defender SmartScreen on security-hardened systems.
Method 3: REST Endpoint (Custom Integrations)
The REST endpoint accepts JSON arrays of raw Windows Security Event Log entries. Use this for custom log shippers, scripts, SIEM forwarding rules, or any integration that can POST JSON over mTLS.
Auth: mTLS (Bridge certificate required) Limit: 10 MB per request
Each entry in the array represents one Security Event Log record:
json
[
  {
    "timestamp": "2026-03-13T14:32:00Z",
    "event_id": 4624,
    "host": "DC01.corp.local",
    "source": "windows",
    "domain": "corp.local",
    "bridgeId": "prod-corp-dc01",
    "attributes": {
      "TargetUserName": "john.doe",
      "LogonType": "3",
      "IpAddress": "10.0.1.42",
      "AuthenticationPackageName": "Kerberos"
    }
  }
]
The attributes map carries the raw fields from the Windows Event Log XML. Field names correspond to the XML element names in the event record (e.g., TargetUserName, LogonType, SubjectUserSid).
Authentication Options
The telemetry ingestion endpoints support two authentication methods:
- mTLS (Bridge certificates): The default method. Uses the client certificate from your Bridge deployment bundle.
- API key: An alternative that avoids distributing Bridge certificates to collector hosts. The OTel Collector sends a
telemetry:write-scoped API key in the request header. See the API Key Management guide for creating and managing keys.
When you generate a collector configuration from the Collector Setup tab in the Admin Telemetry Dashboard (see below), the platform auto-creates an API key and embeds it in the generated YAML -- no manual key creation required.
Method 4: Auto-Generated OTel Collector Config
The platform can generate a ready-to-deploy OpenTelemetry Collector configuration file for Windows Security Event Log collection. This configuration sets up the Collector on your domain controller (or a Windows Server with forwarded event log access), filters for the relevant security events, and ships them to the platform's OTLP endpoint over mTLS.
The Collector uses the windowseventlog receiver to read events locally — this is the mechanism that gives the platform access to the Security Event Log that the Bridge container itself cannot reach.
To generate the configuration, use the Collector Setup tab in the Admin Telemetry Dashboard, or contact your platform administrator.
The generated YAML file includes:
windowseventlog/securityreceiver: Reads the Windows Security event log channel in real time (1-second poll interval), pre-filtered to only the event IDs relevant to identity security.windowseventlog/systemreceiver: Reads the System event log for service installation events (Event 7045).- Batch processor: Sends events in batches of up to 100 records with a 5-second flush timeout.
- Resource processor: Injects your Bridge ID and domain name as resource attributes.
- Memory limiter: Caps Collector memory usage at 256 MB.
- OTLP/HTTP exporter: Ships events to the platform over mTLS using your Bridge certificates, with exponential retry (5-second initial, up to 5-minute total) and a 1000-event send queue.
Deploy the generated config on a Windows domain controller or Windows Server that has access to the Security Event Log you want to collect.
Important: The
windowseventlogreceiver is not available in the OTel Collector core distribution. Your collector must be a distribution that includes it — see the compatible collectors table above.
If you already have a compatible collector running (Splunk OTel or otelcol-contrib): Merge the generated pipelines into your existing config file. The GraphnAI pipeline uses distinct receiver, processor, and exporter names (prefixed with graphnai_), so it runs alongside your existing pipelines without interference. Your collector continues shipping data to its original destination while simultaneously forwarding security events to GraphnAI.
If you need to install a collector: Install the Splunk Distribution of OpenTelemetry Collector (code-signed, standard OTel YAML config). After installing, load the generated config:
powershell
# Merge the generated config into your Splunk OTel Collector config
# Default location: C:\ProgramData\Splunk\OpenTelemetry Collector\agent_config.yaml
# Add the GraphnAI receivers, processors, exporters, and pipeline sections
# Then restart the service:
Restart-Service "splunk-otel-collector"
Collection tiers:
| Tier | Event Count | Use Case |
|---|---|---|
| Tier 1 (default) | 27 events | Core authentication, account management, group changes, Kerberos/NTLM, directory services |
| Tier 2 | 71 events | Tier 1 + extended auth, object access, policy changes, additional account/group events |
OTLP endpoint details: The generated config ships events to the platform's OTLP/HTTP JSON endpoint. If you already have an OpenTelemetry Collector deployed for other purposes, you can add the platform as an additional exporter in your existing config — point the otlphttp exporter at your GraphnAI server and include the Bridge mTLS certificates.
Resource-level attributes identify the source Bridge and domain:
| Resource Attribute | Purpose | Example |
|---|---|---|
graphnai.bridge_id | Associates events with a specific Bridge | prod-corp-dc01 |
graphnai.domain | Specifies the source domain | corp.local |
host.name or host.hostname | Identifies the originating host | DC01.corp.local |
Supported Events
The platform processes the following Windows Security Event Log entries at Tier 1. All 27 events are collected and normalized by default.
Authentication
| Event ID | Description | What It Produces |
|---|---|---|
| 4624 | Successful logon | HasSession edge (user → computer), Tier 3 promotion on the subject's access paths |
| 4625 | Failed logon attempt | Alert annotation on the target identity if repeated |
| 4634 | Logon session terminated (logoff) | Removes or expires the HasSession edge |
| 4648 | Logon with explicit credentials (RunAs, PtH indicator) | HasSession edge flagged as explicit-credential session |
Kerberos
| Event ID | Description | What It Produces |
|---|---|---|
| 4768 | Kerberos TGT requested | Session creation, Tier 3 promotion |
| 4769 | Kerberos service ticket requested | Session annotation with requested service |
| 4771 | Kerberos pre-authentication failed | Alert annotation (repeated failures indicate Kerberoasting or password spray) |
NTLM
| Event ID | Description | What It Produces |
|---|---|---|
| 4776 | NTLM credential validation | Session creation via NTLM (lower confidence than Kerberos) |
| 8004 | NTLM audit (blocked NTLM attempt) | Alert when NTLM is blocked by policy |
Privileges
| Event ID | Description | What It Produces |
|---|---|---|
| 4672 | Special privileges assigned to new logon (admin session) | Annotates the HasSession edge with admin flag, surfaces in risk scoring |
Account Management
| Event ID | Description | What It Produces |
|---|---|---|
| 4720 | User account created | Node update (flags new account) |
| 4722 | User account enabled | Node update |
| 4724 | Password reset attempt | Node annotation |
| 4725 | User account disabled | Node update |
| 4726 | User account deleted | Node removal |
| 4738 | User account properties changed | Node update |
| 4740 | User account locked out | Node annotation, alert if repeated |
Group Management
| Event ID | Description | What It Produces |
|---|---|---|
| 4728 | Member added to global security group | MemberOf edge created, Tier 3 promotion |
| 4729 | Member removed from global security group | MemberOf edge removed |
| 4732 | Member added to local security group | MemberOf edge created |
| 4733 | Member removed from local security group | MemberOf edge removed |
| 4756 | Member added to universal security group | MemberOf edge created |
| 4757 | Member removed from universal security group | MemberOf edge removed |
Directory Services
| Event ID | Description | What It Produces |
|---|---|---|
| 4662 | Directory service object accessed | Access annotation; triggers DCSync detection if Replicating Directory Changes right is accessed |
| 5136 | Directory service object modified | Node or edge update reflecting the attribute change |
Policy
| Event ID | Description | What It Produces |
|---|---|---|
| 4719 | System audit policy changed | Policy change alert |
Service
| Event ID | Description | What It Produces |
|---|---|---|
| 7045 | New service installed | Alert (potential persistence mechanism — commonly used in lateral movement) |
How Events Become Graph Changes
When the platform receives a telemetry event, it passes through a four-stage pipeline before anything appears in the graph:
1. Normalization: The raw event (whether from the REST endpoint or OTLP) is matched to a handler for its Event ID. The handler extracts the relevant fields — who performed the action (TargetUserName, SubjectUserName), on which host, using which protocol — and produces a normalized event record with a consistent structure regardless of the original source format.
2. Identity resolution: The normalized event's subject and target identifiers (usernames, computer names) are matched against existing identity nodes in the graph. If a logon event references [email protected] and a corresponding identity node exists from a previous directory sync, the event is correlated to that node. Events that cannot be matched to existing nodes are still stored in the event log but do not produce graph edges.
3. Graph action derivation and execution: Based on the event type and outcome, the platform derives one or more graph actions:
- Create edge: A successful logon creates a
HasSessionedge from the user identity to the computer. - Promote edge: A confirmed session promotes the subject's existing
MemberOforHasPermissionedges from Tier 1/2 to Tier 3 (Validated), reflecting that this access path is real, not just configured. - Update node: Account creation or modification events update the corresponding identity node's properties.
- Remove edge: Logoff events or group removal events retire the corresponding edges.
- Create alert: Events matching threat patterns (DCSync access, repeated auth failures, new service installation) generate detection alerts.
4. ITDR detection evaluation: The normalized event batch is passed to the threat detection engine, which evaluates it against configured detection rules. Matches produce alerts surfaced in the Risk Posture Dashboard.
The entire pipeline from event receipt to graph update takes under one second for typical event volumes. Batches are flushed every second or when 100 events accumulate, whichever comes first.
Admin Telemetry Dashboard
Requires role: Admin
Navigate to Admin > Telemetry in the sidebar. This page provides a four-tab dashboard for monitoring the telemetry pipeline, browsing events, reviewing detection rules, and generating OTel Collector configurations.
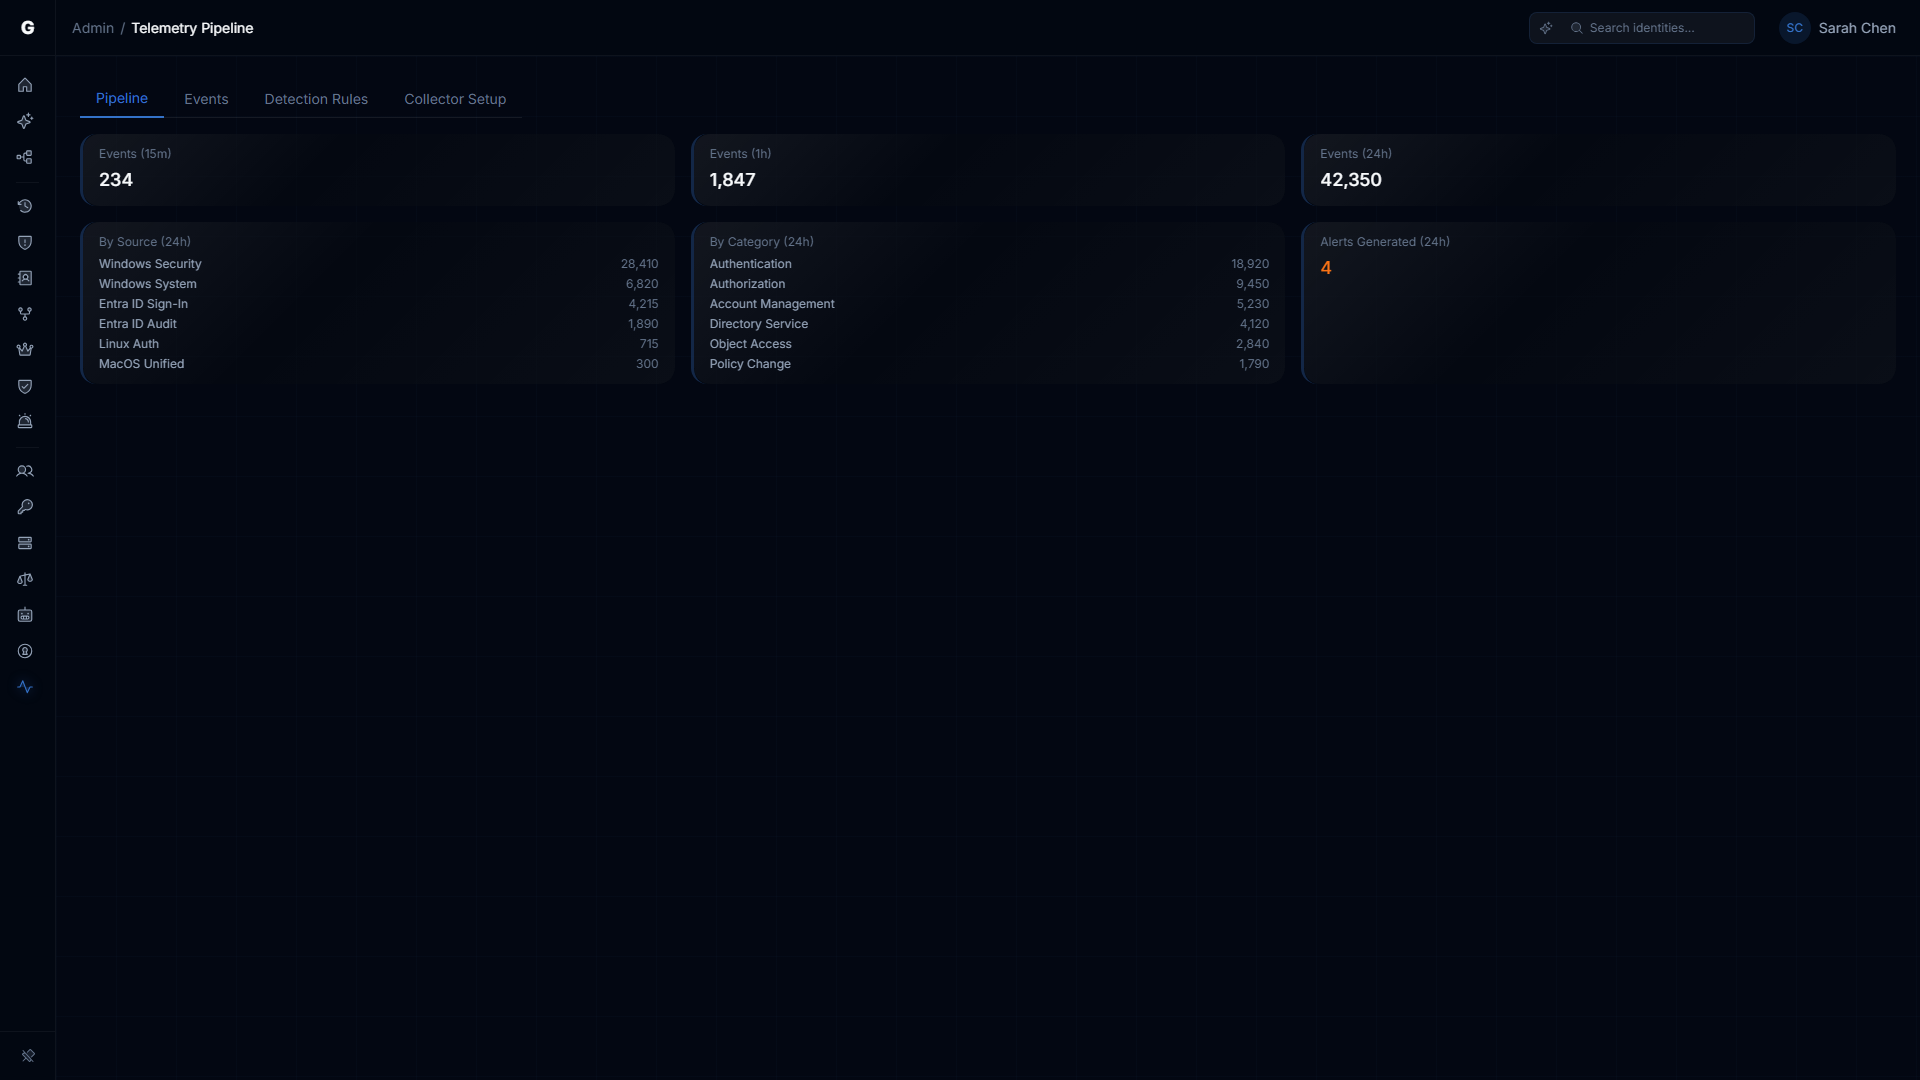
Pipeline Tab
The Pipeline tab is the landing view. It shows a real-time summary of telemetry activity across three time windows and two breakdowns:
Event count summary cards:
| Card | Description |
|---|---|
| Events (15m) | Total normalized events received in the last 15 minutes |
| Events (1h) | Total normalized events received in the last hour |
| Events (24h) | Total normalized events received in the last 24 hours |
Breakdown cards:
- By Source (24h): Shows event counts grouped by telemetry source (e.g., Windows, Entra ID, Okta, AWS, Linux, macOS). Useful for confirming which environments are actively sending data.
- By Category (24h): Shows event counts grouped by event category (e.g., Authentication, Account Mgmt, Kerberos). Displays the top 6 categories by volume. Useful for understanding the event mix and identifying gaps (e.g., no Kerberos events may indicate missing audit policy).
- Alerts Generated (24h): Count of detection alerts produced by the ITDR engine in the last 24 hours. Displays a warning indicator when alerts are present.
Empty state: When no telemetry events have been received (both 15m and 1h counts are zero), the Pipeline tab displays a message directing you to deploy an OpenTelemetry Collector and pointing to the Collector Setup tab.
Events Tab
The Events tab provides a full event browser with server-side pagination and filtering. Use this to investigate specific authentication events, trace identity activity, or verify that particular event types are flowing correctly.
Table columns:
| Column | Description |
|---|---|
| Time | Event timestamp, formatted as local time |
| Source | Telemetry source (Windows, Entra ID, Okta, AWS, Linux, macOS) |
| Category | Event category (Authentication, Account Mgmt, Group Mgmt, Privilege, etc.) |
| Action | Specific action (e.g., logon_interactive, group_member_added, password_reset) |
| Subject | The identity that performed the action (truncated; hover for full value) |
| Target | The target identity or resource, if applicable |
| Outcome | Success (green) or failure (red) |
| Severity | Badge showing event severity when above informational level |
Filters: The toolbar at the top of the table provides four filter controls. All filters are applied server-side and reset pagination to the first page when changed.
- Source: Filter by telemetry source. Options: All Sources, Windows, Entra ID, Okta, AWS, Linux, macOS.
- Category: Filter by event category. Options: All Categories, Authentication, Account Mgmt, Group Mgmt, Privilege, Directory, Kerberos, NTLM, Policy, Service.
- Range: Time window. Options: Last 1h, Last 24h (default), Last 7d, Last 30d.
- Subject search: Free-text search on the subject identity field (case-insensitive substring match).
Pagination: Results are returned in pages of 50 events. When more than 50 events match the current filters, Previous/Next buttons appear at the bottom with a count indicator (e.g., "51-100 of 1,234").
Event detail dialog: Click any row to open a detail dialog showing all fields for that event, including:
- Core fields: Timestamp, Source, Category, Action, Severity, Subject, Target, Source Host, Target Host, Protocol, Outcome, Raw Event ID, Domain, Bridge ID
- Raw attributes: The original key-value pairs from the source event (e.g., Windows Event Log XML fields like
TargetUserSid,LogonType,AuthenticationPackageName)
Detection Rules Tab
The Detection Rules tab displays the configured ITDR detection rules. These rules are evaluated by the threat detection engine against incoming telemetry events (see How Events Become Graph Changes above).
Table columns:
| Column | Description |
|---|---|
| Rule | Rule name (e.g., "brute force", "kerberoasting") |
| Description | What the rule detects |
| Severity | Color-coded severity badge (Critical, High, Medium, Low) |
| MITRE | MITRE ATT&CK technique ID, linked to the ATT&CK website |
| Window | Time window for event correlation (e.g., 5m, 10m, 1m). Rules with no window (0) trigger immediately. |
| Threshold | Number of matching events required to fire the rule |
Built-in rules (Phase 1):
| Rule | Severity | MITRE ATT&CK | Window | Threshold |
|---|---|---|---|---|
| Brute Force | High | T1110.001 | 5m | 10 failed logons for a single account |
| Password Spray | High | T1110.003 | 10m | 5+ accounts targeted from fewer than 3 sources |
| Kerberoasting | Critical | T1558.003 | 1m | 3+ TGS requests with RC4 encryption from one user |
| DCSync | Critical | T1003.006 | 1m | 1 directory replication by a non-DC account |
| Tier 0 Group Change | Critical | T1098 | Immediate | 1 membership change to a Tier 0 privileged group |
| Audit Tampering | Critical | T1562.002 | Immediate | 1 audit policy modification event |
Detection alerts generated by these rules appear in the Risk Posture Dashboard.
Collector Setup Tab
The Collector Setup tab generates a ready-to-deploy OpenTelemetry Collector configuration file. This is the recommended way to configure event forwarding -- it produces a complete YAML config with authentication, filtering, and batching pre-configured.
Form fields:
| Field | Description | Default |
|---|---|---|
| Server Endpoint | The OTLP receiver URL on your GraphnAI server | Auto-filled with the current browser origin |
| Domain Name | The AD domain to collect events for (e.g., corp.example.com) | Required |
| Collection Tier | Event coverage level | Tier 1 |
Collection tier options:
- Tier 1 (Beta): 27 core security events covering authentication, Kerberos, NTLM, account management, group management, directory services, policy changes, and service installation. Sufficient for Tier 3 promotion and all six detection rules.
- Tier 2 (MVP): 71 events (Tier 1 + 44 extended events). Adds extended authentication events, object access auditing, additional privilege events, and broader policy change coverage.
Note: The tier labels in the Collector Setup dropdown show approximate event counts. The actual counts are 27 (Tier 1) and 71 (Tier 2) based on the event ID lists in the backend configuration. See Supported Events for the full Tier 1 event list.
API key auto-creation: When you click Generate Config, the platform automatically:
- Creates a
telemetry:write-scoped API key for the specified domain - Revokes any previously auto-created OTel Collector key for the same domain (to prevent orphaned keys)
- Embeds the API key in the generated YAML config
The API key prefix is displayed in a confirmation banner after generation. The full key is only present in the generated YAML and cannot be retrieved again. Manage keys on the API Key Management page.
Generated config preview: After generating, the YAML configuration appears in a code block with:
- Copy button: Copies the YAML to clipboard
- Download button: Downloads the YAML as a file (named
otel-collector-{domain}.yaml)
The generated config includes all the components described in Method 4: Auto-Generated OTel Collector Config: windowseventlog receivers, batch processor, resource processor, memory limiter, and OTLP/HTTP exporter with retry and send queue.
Deployment instructions are shown below the YAML preview, including compatible collector distributions (Splunk OTel Collector recommended, otelcol-contrib as alternative).
Configuring Windows Audit Policy
For the platform to receive the events listed above, audit policy must be enabled on your domain controllers. The recommended approach is to configure audit policy via a Group Policy Object (GPO) linked to the Domain Controllers OU.
Recommended GPO Settings
Navigate to: Computer Configuration > Policies > Windows Settings > Security Settings > Advanced Audit Policy Configuration > Audit Policies
| Subcategory | Setting | Events Produced |
|---|---|---|
| Account Logon > Audit Credential Validation | Success, Failure | 4776 |
| Account Logon > Audit Kerberos Authentication Service | Success, Failure | 4768, 4771 |
| Account Logon > Audit Kerberos Service Ticket Operations | Success, Failure | 4769 |
| Logon/Logoff > Audit Logon | Success, Failure | 4624, 4625, 4648 |
| Logon/Logoff > Audit Logoff | Success | 4634 |
| Logon/Logoff > Audit Special Logon | Success | 4672 |
| Account Management > Audit User Account Management | Success, Failure | 4720, 4722, 4723, 4724, 4725, 4726, 4738, 4740 |
| Account Management > Audit Security Group Management | Success | 4728, 4729, 4732, 4733, 4756, 4757 |
| DS Access > Audit Directory Service Access | Success, Failure | 4662 |
| DS Access > Audit Directory Service Changes | Success | 5136 |
| Policy Change > Audit Audit Policy Change | Success | 4719 |
For Event 7045 (new service installation): This event is generated by the Service Control Manager and does not require audit policy configuration. It appears in the System event log automatically.
Applying the GPO
- Open Group Policy Management on a domain controller or management workstation
- Create a new GPO (e.g.,
GraphnAI Security Audit Policy) or edit your existing security baseline GPO - Link the GPO to the Domain Controllers OU
- Configure the subcategories listed above
- Run
gpupdate /forceon domain controllers to apply immediately, or wait for the background policy refresh interval (default 5 minutes for domain controllers)
To verify the policy applied correctly, run on a domain controller:
powershell
auditpol /get /category:*The relevant subcategories should show Success or Success and Failure in the Inclusion Setting column.
TIP
Start with Logon/Logoff and Account Logon subcategories first — these produce the most valuable telemetry for Tier 3 promotion. Add directory service auditing once you have confirmed the basic pipeline is working.
IMPORTANT
Enabling audit logging increases event log volume on domain controllers. Monitor your Security event log size and ensure the log is configured to overwrite as needed, or that your log archiving policy can handle the increased volume.
Testing the Pipeline
Before relying on the pipeline in production, verify that events flow correctly from your domain controllers to the graph.
Step 1: Generate a Test Event
Log on to any domain-joined workstation using a domain account. This generates Event 4624 on the domain controller that authenticated the request.
Alternatively, trigger a test logon event using PowerShell (run on a domain controller):
powershell
# Trigger a test logon event by verifying credentials
$cred = Get-Credential
$domain = [System.DirectoryServices.ActiveDirectory.Domain]::GetCurrentDomain()
Or use runas to generate an explicit credential event (Event 4648):
powershell
runas /user:corp\testuser cmd.exeStep 2: Verify Events Are Reaching the Platform
After generating test events, check the Admin Telemetry Dashboard (Admin > Telemetry in the sidebar) to confirm events are being received. The Pipeline tab should show increasing event counts in the 15-minute and 1-hour summary cards. You can also use the Events tab to search for your test user and verify the specific event appeared.
Step 3: Confirm the Edge Appears in the Graph
- Log in to GraphnAI Platform with an Operator or Admin account
- Navigate to Graph Explorer in the sidebar
- Search for the user who logged on (e.g.,
john.doe) - Focus on the user node
- Look for a
HasSessionedge connecting the user to the target computer (e.g.,DC01)
The edge should be visible within a few seconds of the event being ingested. If the user identity and computer identity both exist in the graph from a previous directory sync, the HasSession edge will appear and the user's existing MemberOf and HasPermission edges will be promoted to Tier 3 (shown in the graph with the Validated fidelity indicator).
Monitoring
Pipeline Queue Health
The telemetry pipeline uses an internal queue with a capacity of 100 batches. If the queue fills faster than the pipeline can process events, new incoming events are rejected with an error. Under normal operating conditions the queue depth stays near zero.
You can check pipeline health via the Prometheus metrics endpoint (requires network access to the server, not a platform login). Key metrics to watch:
| Metric | Description | Normal Range |
|---|---|---|
graphnai_telemetry_events_ingested_total | Total events accepted by the pipeline since startup | Increasing steadily |
graphnai_telemetry_flush_duration_seconds | Time per batch flush cycle | Under 5 seconds |
graphnai_telemetry_edges_promoted_total | Total Tier 3 promotions performed | Increasing with logon activity |
graphnai_telemetry_queue_drops_total | Events dropped due to queue overflow | Should be 0 |
OTel Collector Health (If Using Sidecar)
The generated config includes a health check extension at http://localhost:13133. Check it from the domain controller:
powershell
Invoke-WebRequest -Uri http://localhost:13133 -UseBasicParsingA 200 OK response means the Collector is running. Check your collector's log output for export errors — the location varies by distribution (Windows Event Log, journald, or a log file in the collector's install directory). Look for lines containing "error" in the exporter output. A consistent "connection refused" or "tls: certificate" error indicates the Collector cannot reach the platform's OTLP endpoint — check your Bridge certificate paths and server connectivity.
Verifying Tier 3 Promotions
In the Graph Explorer, Tier 3 (Validated) edges are visually distinguished from Tier 1 (Theoretical) and Tier 2 (Constrained) edges. After telemetry begins flowing:
- Focus on an identity that has active logon sessions
- Look at the Fidelity indicator on the
MemberOfandHasPermissionedges adjacent to that identity - Edges confirmed by real session events should show Tier 3 — Validated
If edges remain at Tier 1 or 2 after confirmed logon events, verify that the identity node in the graph matches the username in the event. Mismatches (e.g., john.doe in the event vs. [email protected] in the graph) prevent correlation.
Troubleshooting
Events reach the endpoint but no edges appear in the graph
Cause: The identity referenced in the event could not be matched to an existing graph node.
Solution:
- Confirm the domain has completed at least one full sync — the user and computer nodes must exist before telemetry can create edges between them. Check the Bridge detail page Sync History.
- Check that the
domainfield in the event payload matches the domain name configured in the Bridge (e.g.,corp.local, notCORPorCORP.LOCAL). Domain matching is case-insensitive but must be the FQDN. - The
TargetUserNamein the event must match thesAMAccountNameof an identity node. Machine accounts end in$— if the event hasWORKSTATION01$but the graph node isWORKSTATION01, the match will fail.
mTLS connection rejected (403 or TLS handshake error)
Cause: The client certificate presented to the ingestion endpoint is not a valid Bridge certificate issued by the platform CA.
Solution:
- Verify you are using the
cert.pemandkey.pemfiles from the Bridge bundle downloaded from the platform — not a self-signed or enterprise-issued certificate. - Confirm the
ca.crtyou are trusting is the platform's internal CA, not your enterprise CA. - If the Bridge bundle is old, check whether the certificate has expired. Bridge certificates have a multi-year validity period, but if you downloaded the bundle years ago, contact an Admin to re-download the bundle from the platform.
"telemetry queue full" errors in Bridge logs
Cause: The pipeline is receiving events faster than it can process them. This usually indicates a burst of events (e.g., a mass logon event during a shift change) or a slow graph write operation.
Solution:
- Check the
graphnai_telemetry_flush_duration_secondsmetric — if flush cycles are taking more than 5 seconds, the database may be under load. - If the condition is persistent rather than a one-time burst, consider reducing the polling frequency in the OTel Collector configuration (
poll_intervalfrom 1s to 5s) to smooth the event rate. - Queue-full conditions are transient — the queue recovers automatically once the burst subsides. No events are corrupted; only the batch that caused the overflow is dropped.
Audit policy is configured but no events appear
Cause: The GPO may not have applied to domain controllers, or the event log access is not configured correctly.
Solution:
- Run
auditpol /get /category:*on a domain controller and verify the relevant subcategories show the expected inclusion settings. - Attempt a logon and check whether Event 4624 appears in the Security event log on the domain controller:
Get-WinEvent -LogName Security -MaxEvents 10 | Where-Object Id -eq 4624 - If events appear in the local event log but not in the graph, the issue is in the forwarding path (Bridge or OTel Collector), not the audit policy.
Kerberoasting or DCSync detection alerts not firing
Cause: The detection engine requires both the relevant events (4769 for Kerberoasting, 4662 for DCSync) and the events to be correlated to identity nodes. If events arrive but identity correlation fails, the detection rules may not have enough context to fire.
Solution:
- Verify Events 4769 and 4662 are reaching the platform (check the Events tab in the Admin Telemetry Dashboard).
- Ensure Directory Service auditing (4662) is enabled — this is a common audit policy gap since it generates high event volume. Consider enabling it for Failure only first, then adding Success after verifying volume is manageable.
- Contact your platform administrator to confirm detection rules are enabled in the ITDR configuration.
Related Features
- Risk Posture Dashboard: Detection alerts generated from telemetry events appear here, including Kerberoasting attempts, unusual privilege escalation, and lateral movement indicators.
- Asset Criticality: Tier 3 (Validated) edges produced by the telemetry pipeline feed into criticality evaluation. Identities with active sessions to Tier 0 assets receive elevated criticality scores.
- Identity Bridge: The Bridge is the primary deployment mechanism for telemetry forwarding. Understanding sync behavior helps diagnose cases where telemetry events reference identities not yet synced to the graph.
- Stale Identity Detection: Telemetry-derived
lastActivitytimestamps update the staleness calculation for identities, providing more accurate inactivity signals than directory sync alone. - API Key Management: Create and manage
telemetry:writeAPI keys for OTel Collector authentication. The Collector Setup tab auto-creates keys, but you can also create and revoke them manually.