Detection Alerts
View, triage, and investigate identity threat detection alerts with graph-enriched context, blast radius visualization, and integrated remediation.
Requires role: Operator+ (viewing/investigation), Admin (status management)
Related: ITDR Detection, Telemetry Pipeline, Risk Posture Dashboard, Identity Investigation Timeline, Select Fire, Multi-Agent Intelligence
Overview
The Detection Alerts page is the investigation surface for ITDR (Identity Threat Detection and Response) alerts. When the telemetry pipeline detects suspicious activity — brute force attempts, Kerberoasting, DCSync requests, Tier 0 group changes, or audit tampering — the detection engine generates alerts that appear here.
Each alert is enriched with context from the identity graph:
- Subject identity type and criticality — Is the targeted account a User, ServiceAccount, or Computer? Is it Tier 0?
- Blast radius — How many nodes can an attacker reach from this identity through the access graph?
- MITRE ATT&CK mapping — Each detection rule maps to a specific MITRE technique ID for correlation with threat intelligence
- Behavioral context — Timeline of recent activity, access intelligence, and anomaly indicators
This transforms alerts from "something happened, go investigate" to "here's what happened, here's the identity context, and here's the blast radius if the attack succeeds."
Prerequisites
- Role: Operator or Admin to view alerts. Admin to change alert status (acknowledge, resolve, mark as false positive).
- Telemetry flowing: At least one Identity Bridge must be forwarding Windows Security Events to the platform. See the Telemetry Pipeline guide.
- Identity graph populated: At least one full sync must have completed so identity nodes exist for blast radius enrichment.
TIP
If you have the bridge running but are unsure whether telemetry is flowing, check Admin > Telemetry in the sidebar. The Pipeline tab shows event counts for the last 15 minutes, 1 hour, and 24 hours.
Accessing Detection Alerts
Navigate to Analysis > Detection Alerts in the left sidebar.
The page can also be reached from:
- Risk Posture Dashboard — The Alert Severity factor card links here
- Identity Investigation Timeline — Alert entries in the timeline link to this page
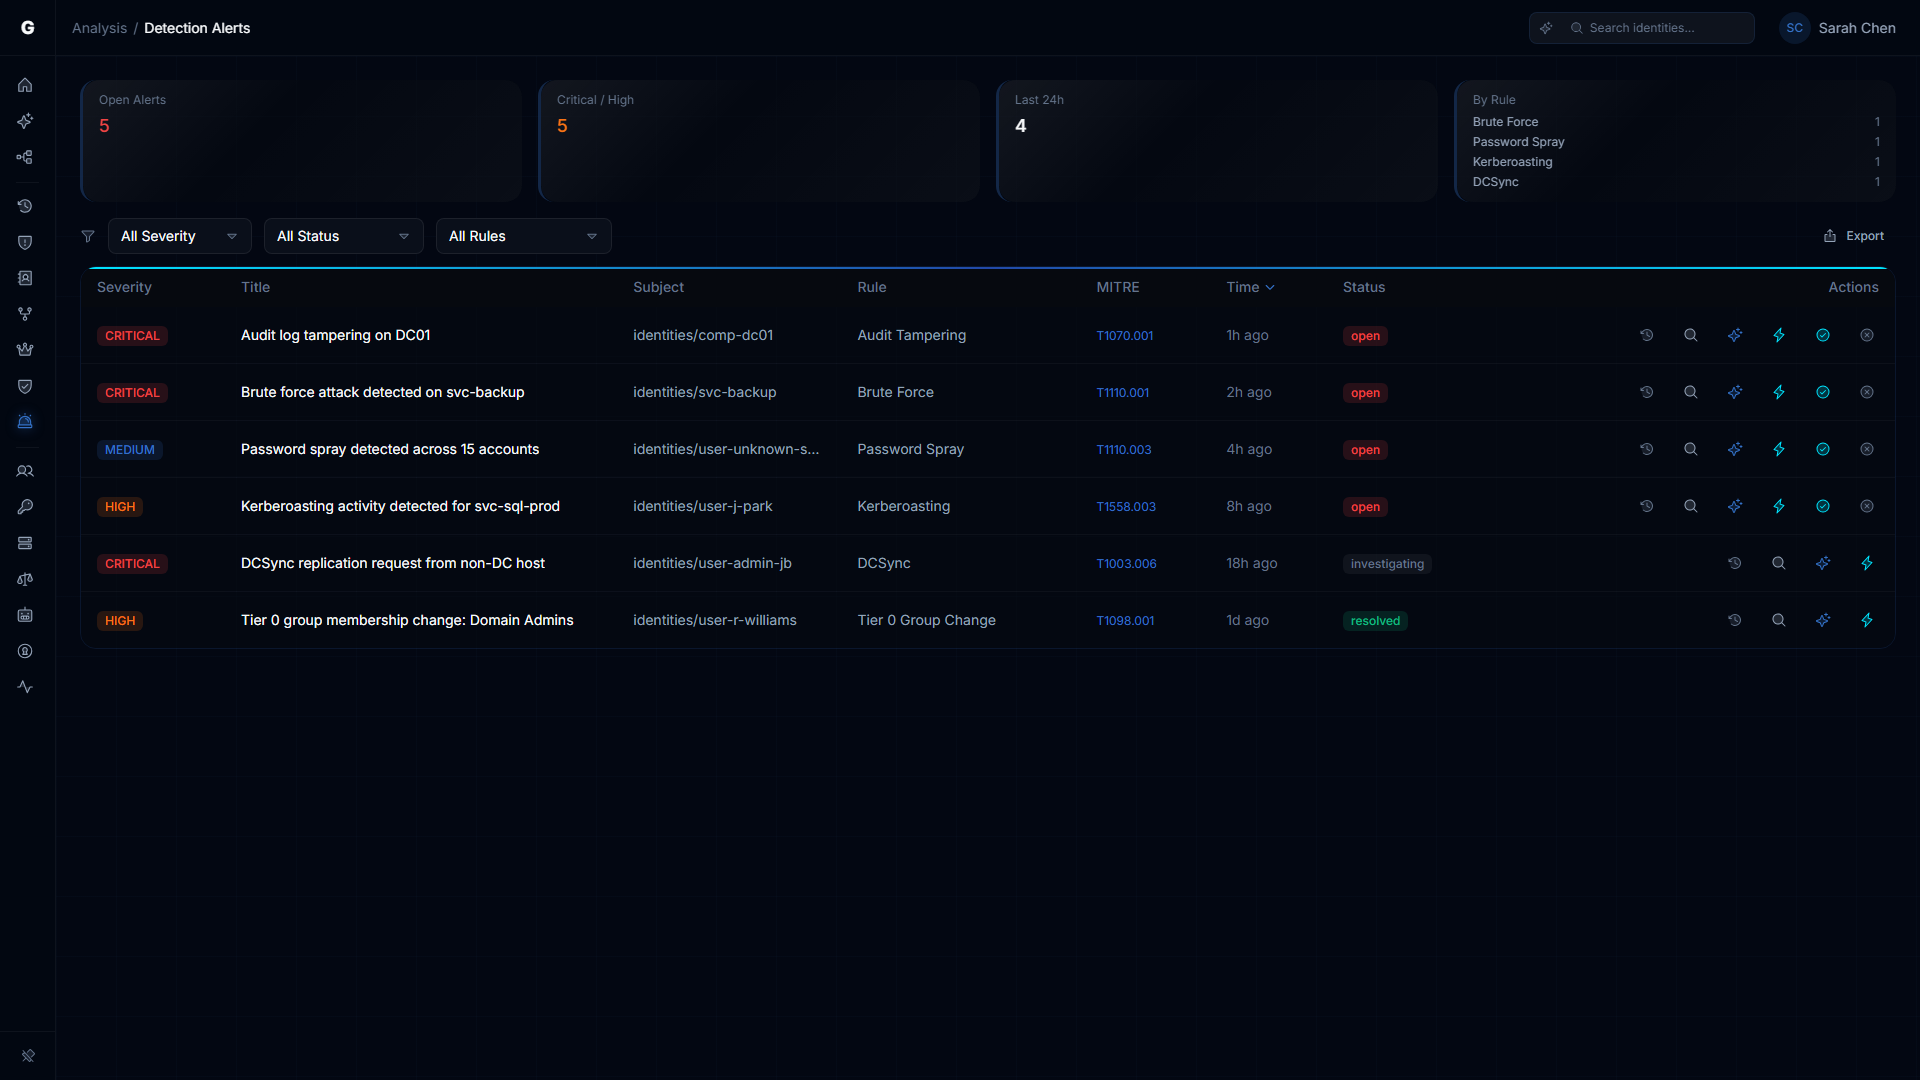
Summary Cards
Four cards at the top provide an overview:
| Card | Description |
|---|---|
| Open Alerts | Count of alerts in "open" status. Red when > 0. |
| Critical / High | Combined count of critical and high severity alerts |
| Last 24h | Number of alerts generated in the past 24 hours |
| By Rule | Top 4 detection rules by alert count |
Alert Table
The main table lists all detection alerts.
Columns
| Column | Description |
|---|---|
| Severity | CRITICAL, HIGH, MEDIUM, LOW, or INFO (color-coded badge) |
| Title | Alert title describing what was detected |
| Subject | The identity targeted or involved in the alert |
| Rule | Detection rule that fired (e.g., "Brute Force", "Kerberoasting") |
| MITRE | MITRE ATT&CK technique ID — clickable link to the MITRE ATT&CK page |
| Time | Relative timestamp (e.g., "2 hours ago") |
| Status | open, acknowledged, resolved, or false positive |
Row Actions
Each row has inline action buttons:
- Timeline (clock icon) — Navigate to the Identity Investigation Timeline for the alert's subject
- AI Explain (sparkle icon, if AI agent is configured) — Get an AI-generated explanation of the alert
- Select Fire (lightning icon) — Open Select Fire to remediate the affected identity
- Acknowledge (check icon, Admin only, open alerts) — Mark as acknowledged
- False Positive (X icon, Admin only, open alerts) — Mark as false positive
Sorting and Filtering
- Sort: Click any sortable column header. Default: most recent first.
- Severity filter: All / Critical / High / Medium / Low
- Status filter: All / Open / Acknowledged / Resolved / False Positive
- Rule filter: All / specific detection rule name
- CSV Export: Export filtered alert data
Detail Flyout
Click an alert row to open the detail flyout on the right side. The layout switches to the standard analysis page pattern:
Blast Radius Graph
An inline graph visualization showing the subject identity and its reachable resources. Click aggregate nodes to drill down into specific identities.
Identity Detail Panel
The flyout shows the subject identity's properties, investigation navigation tabs, and:
- Alert detail sections — Rule description, event IDs, graph context (blast radius count, subject type, criticality tier)
- Identity Timeline — Filtered to show events related to this alert, with the triggering events highlighted
- Access Intelligence — Permission and access path analysis for the subject identity
Flyout Actions
The flyout footer provides contextual actions:
| Button | Role | Description |
|---|---|---|
| Investigate | Operator+ | Navigate to Graph Explorer focused on the subject identity |
| Select Fire | Operator+ | Open Select Fire remediation workflow |
| Acknowledge | Admin | Mark alert as acknowledged (replaces "open" status) |
| False Positive | Admin | Mark alert as false positive |
| Resolve | Admin | Mark acknowledged alert as resolved |
Alert Status Workflow
Alerts follow a lifecycle:
open → acknowledged → resolved
  \
→ false_positive- Open: Alert was generated by the detection engine. Requires investigation.
- Acknowledged: An operator/admin has reviewed the alert. Investigation is in progress.
- Resolved: The alert has been investigated and remediated (or determined to be acceptable risk).
- False Positive: The alert was not a genuine threat. Helps tune detection sensitivity over time.
NOTE
Status management requires Admin role. Operators can view and investigate alerts but cannot change their status.
Detection Rules
The ITDR engine evaluates incoming telemetry against detection rules. The current rules are:
| Rule | MITRE Technique | Description |
|---|---|---|
| Brute Force | T1110 | Multiple failed authentication attempts from the same source within a sliding window |
| Password Spray | T1110.003 | Failed authentication attempts across many accounts from a single source |
| Kerberoasting | T1558.003 | Unusual volume of TGS requests for service accounts with SPNs |
| DCSync | T1003.006 | Replication requests (GetNCChanges) from non-DC sources |
| Tier 0 Group Change | T1098 | Modification of highly privileged group membership (Domain Admins, Enterprise Admins, etc.) |
| Audit Tampering | T1562.002 | Changes to audit policy on domain controllers |
For rule details, thresholds, and time windows, see the ITDR Detection guide.
NOTE
Additional detection rules (lateral movement chains, behavioral baselines, UEBA) are planned for the MVP release. The current 6 rules cover the most common identity attack patterns.
Integration with Other Features
- Risk Posture Dashboard: The Alert Severity factor reflects open alert counts weighted by severity. Resolving alerts improves this score.
- Identity Investigation Timeline: Each alert links to the subject's full timeline. Alert events are highlighted in the timeline view.
- Select Fire: Remediate the affected identity directly from an alert — remove access, revoke group membership, or generate a remediation script.
- Graphne Agent: Ask the agent "What alerts fired in the last 24 hours?" or "Explain the DCSync alert for svc-backup."
Troubleshooting
No alerts showing
- Cause: Telemetry is not flowing, or no events have crossed detection thresholds
- Fix: Check Admin > Telemetry to verify events are being received. The Pipeline tab shows event counts.
- Note: Detection rules use sliding time windows. A single failed logon won't trigger a brute force alert — the threshold must be crossed within the window.
Alert shows "Unknown" for subject
- Cause: The identity referenced in the alert doesn't exist in the graph (possibly a pre-sync event or an external identity)
- Note: The alert is still valid. The subject ID is shown instead of a display name.
Status buttons not appearing
- Cause: Status management requires Admin role
- Fix: Ask an Admin to manage alert status, or have your role upgraded