Graph Explorer
Interactively navigate your identity graph — search, focus, visualize access paths, and inspect connection details including telemetry-enriched session and privilege data.
Requires role: Viewer (read-only exploration), Operator (simulation, Select Fire)
Related: Identity Inventory, Identity Graph Data Model, Identity Investigation Timeline, Telemetry Enrichment, Select Fire, Critical Junctions, Multi-Agent Intelligence, Delegation Posture
TIP
For table-based identity investigation with risk scoring, permission intelligence, and filtering, see the Identity Inventory — it provides a sortable, filterable table of all identities with integrated graph visualization. The Graph Explorer remains the best tool for ad-hoc graph exploration, path finding, and full-screen topology visualization.
Overview
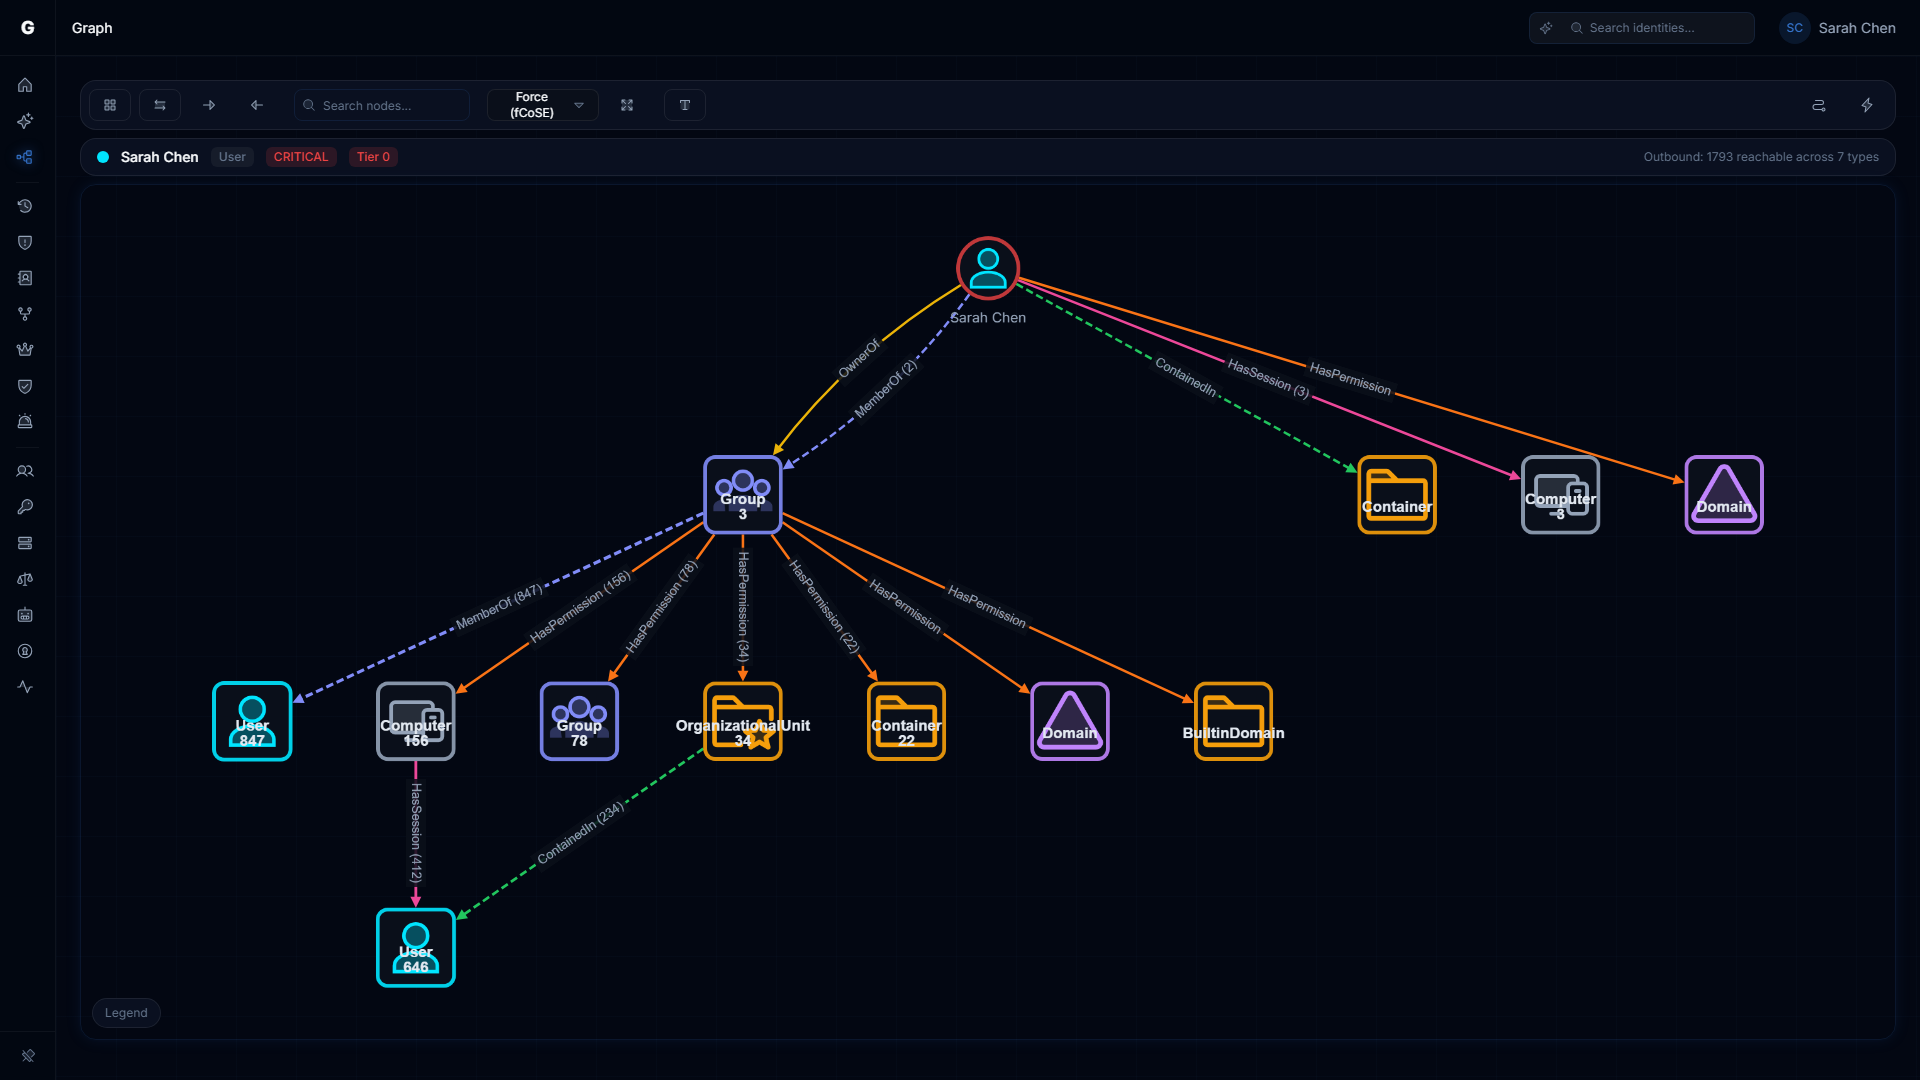
The Graph Explorer is the central visualization tool in the platform. It renders your identity environment as an interactive directed graph — nodes for users, groups, computers, and other identity types; edges for permissions, memberships, sessions, and delegations. You can search for any identity, focus the view on it to see its direct connections, and click any edge or node to open a detail panel.
When telemetry is flowing, the Graph Explorer also shows session connections (confirmed logon activity) and privilege connections (runtime Windows privileges observed on computers) alongside the standard directory-derived connections. These telemetry-enriched edges give you a real-time picture of what is actually happening, not just what the directory says should be possible.
Prerequisites
- At least one sync must have completed to populate the graph
- Viewer role is sufficient for browsing and search
- Operator role is required to create change simulations or launch Select Fire
- Session and privilege connections require telemetry to be flowing — see Telemetry Pipeline
Opening the Graph Explorer
Navigate to Graph Explorer in the left sidebar. The explorer opens in overview mode, showing a sample of the graph.
To focus on a specific identity:
- Type the identity name in the search bar at the top of the page (minimum 2 characters, partial matches supported)
- Select the matching identity from the search results dropdown
- The graph recenters on that identity, showing its direct connections
Alternatively, use the global search bar in the top navigation — searching for an identity name there and selecting a result will open the Graph Explorer focused on that node.
Navigating the Graph
Panning and zooming: Use scroll wheel to zoom; click and drag the canvas to pan.
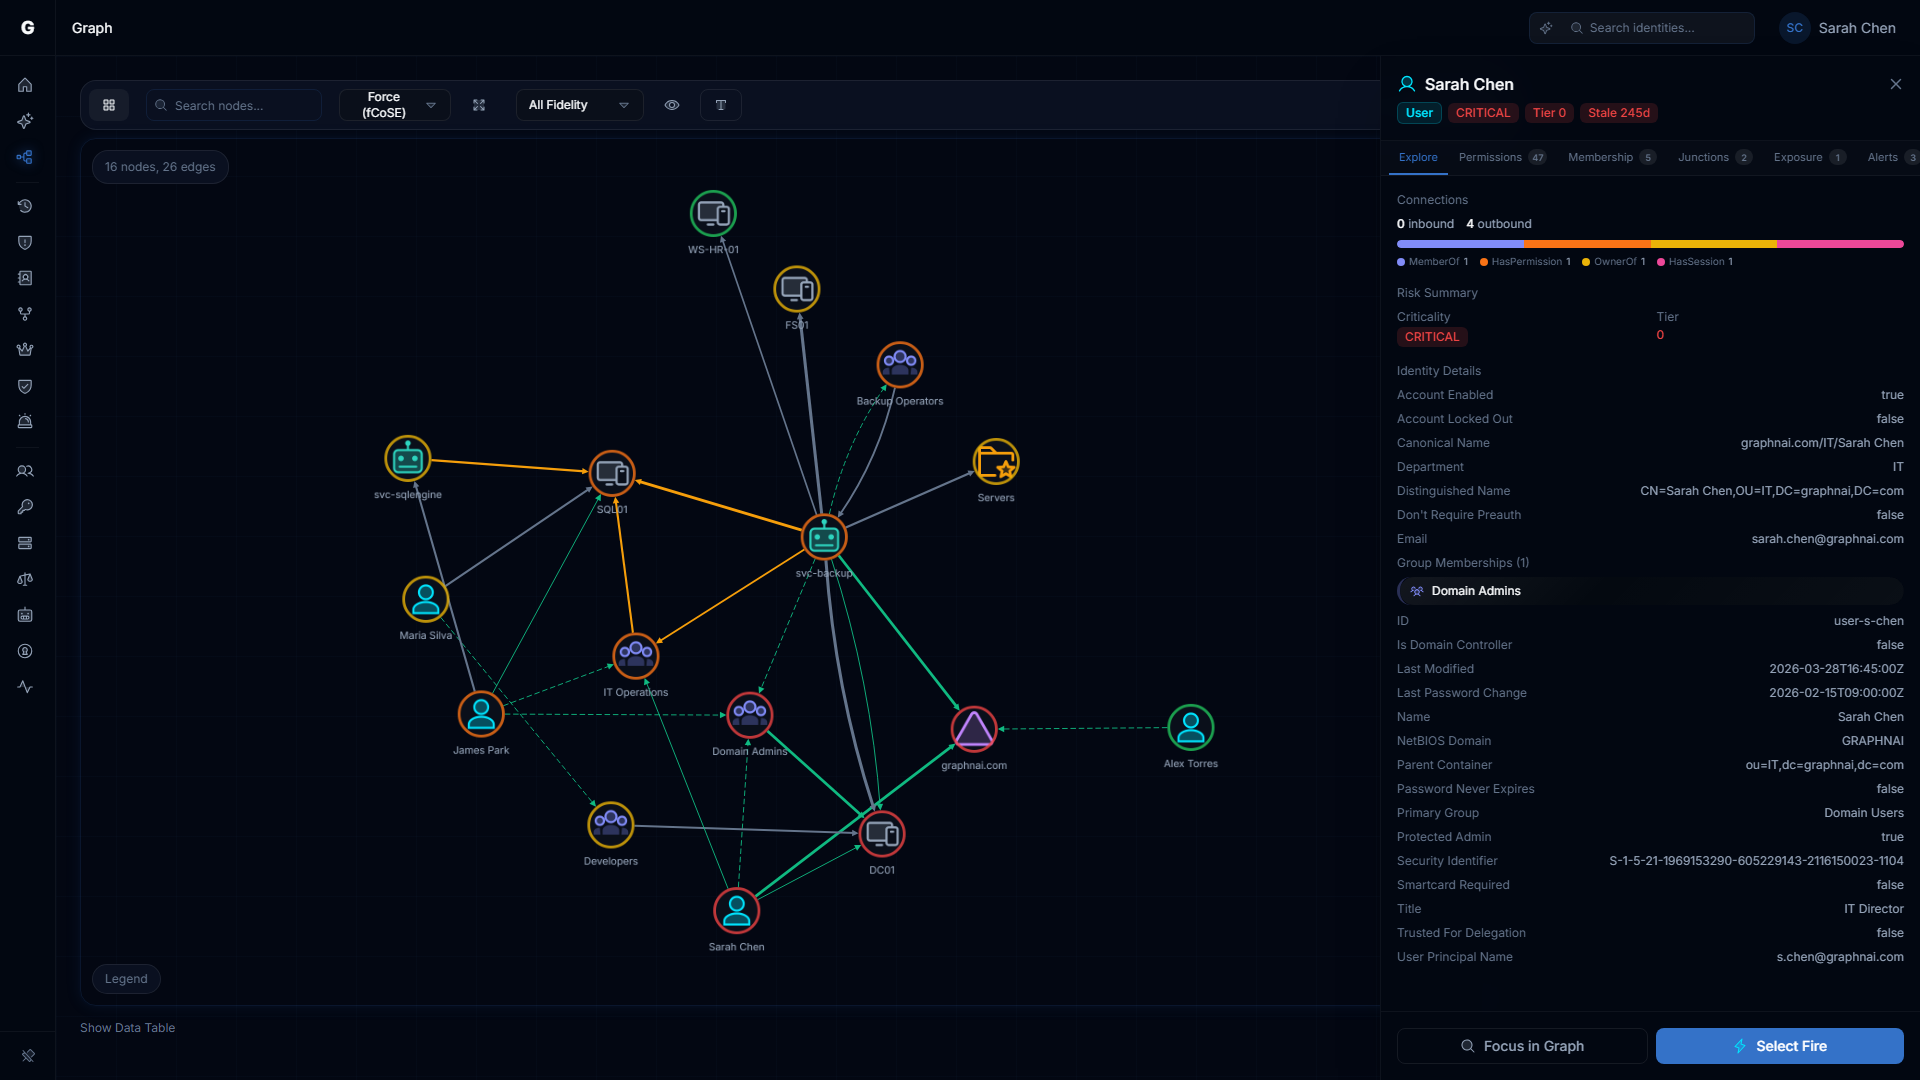
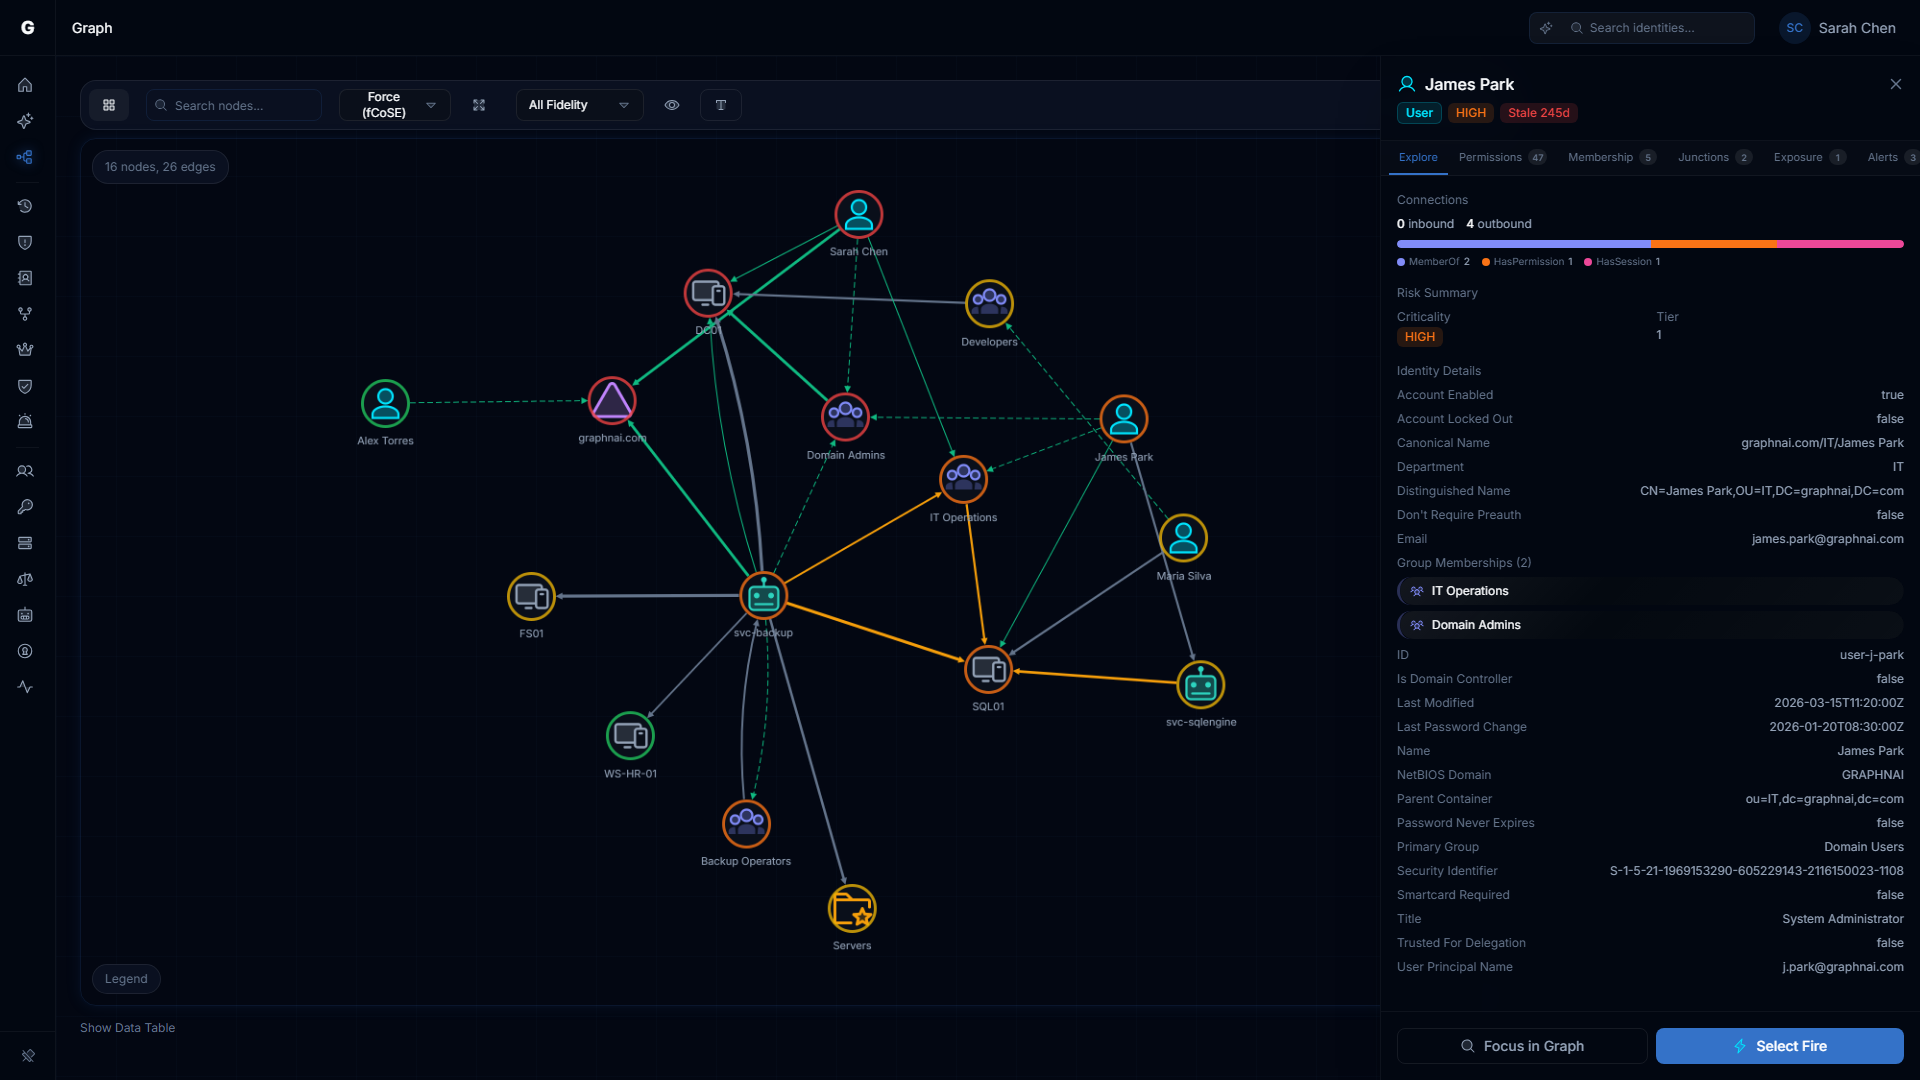
Selecting a node: Click any node to open its detail panel on the right side of the screen. The panel shows the node's type, criticality, tier, domain, and all properties synced from the directory.
Selecting an edge: Click any edge (connection line) to open the edge detail panel. The panel shows the edge type, fidelity tier, and type-specific data (permission names for access edges, session fields for session connections).
Focusing on a node: Double-click any node to refocus the graph on it, loading its direct neighborhood. Use the back button or the breadcrumb trail at the top to navigate back.
Context menu: Right-click any node to open the context menu, which offers:
- Focus — centers and zooms the graph on this node
- View Details — opens the node detail panel
- Find Path From... — shows the shortest access path from this node to another
- Find Path To... — shows the shortest access path to this node from another
- View Timeline — opens the Identity Investigation Timeline for this identity
- Select Fire — launches the Select Fire modal with this identity pre-populated (Operator role required)
- Explain — asks the Graphne AI agent to explain this identity's risk profile (Operator role, AI agent enabled)
Right-click an edge to open the edge context menu with options to inspect the relationship details.
Node Detail Panel
Clicking a node opens the detail panel on the right. The panel shows:
- Identity type with color-coded icon
- Criticality badge — if assigned via Asset Criticality
- Tier 0 indicator — if this is a Tier 0 identity
- Domain — the directory domain this identity belongs to
- Properties — all attributes synced from the directory (account name, email, last seen, admin count, etc.)
- Access Intelligence — when telemetry is available, shows permitted vs actual access metrics (see below)
- Timeline button — click to open the Identity Investigation Timeline for this identity
Edge Detail Panel
Clicking an edge opens the edge detail panel. The fields shown depend on the edge type:
Permission edges (HasPermission, AppRoleAssignment)
| Field | Description |
|---|---|
| Type | The edge type (HasPermission, AppRoleAssignment, etc.) |
| Permissions | List of specific permission names (e.g., GenericAll, WriteProperty) |
| Fidelity | T1 / T2 / T3 indicating confidence level |
| First seen / Last seen | When this edge was first and last observed |
Structural edges (MemberOf, ContainedIn, GPLink)
| Field | Description |
|---|---|
| Type | The edge type |
| Source / Target | The nodes this edge connects |
See Identity Graph Data Model for a full reference on edge types and their meanings.
Fidelity Tiers
Every edge in the graph carries a fidelity tier that indicates how strongly the access has been confirmed:
| Tier | Label | Meaning |
|---|---|---|
| T1 | Theoretical | Derived from directory configuration only — the permission exists in the directory but has not been confirmed by any other signal |
| T2 | Constrained | Additional evidence (such as a corroborating group membership or policy) increases confidence, but no direct session evidence |
| T3 | Validated | Confirmed by telemetry — the identity has been directly observed using this access |
Fidelity only ratchets upward. Once a connection has been validated by telemetry (T3), it stays at T3 even if subsequent sessions use Restricted Admin Mode.
Change Simulation
Operators can simulate access changes to see their blast radius before applying them. Simulated edges appear as dashed connections overlaid on the live graph.
To run a simulation, use the Select Fire workflow — see Select Fire for a full walkthrough.
Session and Privilege Connection Details
When telemetry is flowing, the Graph Explorer shows two additional edge types derived from Windows authentication events. These go beyond what the directory reports and reveal what is actually happening at runtime.
Session Connections
Each time an identity successfully authenticates to a computer (Windows Event 4624), the platform creates or updates a session connection linking the identity to the machine. Rather than creating a separate edge for every logon event, the platform aggregates all sessions between the same identity and computer into a single weighted edge.
Session connections are displayed in cyan in the graph. When you click a session edge, the detail panel shows:
| Field | What it means |
|---|---|
| Event count | Total number of logon events aggregated into this edge |
| First seen / Last seen | Earliest and most recent logon timestamps |
| Protocols | Authentication protocols observed (Kerberos, NTLM, Negotiate) |
| Protocol counts | Per-protocol breakdown (e.g., 142 Kerberos, 3 NTLM) |
| Logon types | How the credential was used — see table below |
| Elevated count | Sessions where the full admin token was granted (UAC elevated) |
| Restricted count | Sessions using Restricted Admin Mode (credentials not cached on target) |
| Logon servers | Domain controllers that authenticated the sessions |
Logon Type Reference
The logon type breakdown is one of the most useful investigative signals. Certain combinations are normal; others indicate misuse or misconfiguration.
| Logon Type | Normal For | Worth Investigating When Seen On |
|---|---|---|
| Interactive (2) | Users at a physical console | Service accounts, admin accounts on workstations |
| Network (3) | File shares, remote admin tools | — |
| Batch (4) | Scheduled tasks | Interactive user accounts |
| Service (5) | Windows services | User accounts |
| NetworkCleartext (8) | IIS basic authentication | Any identity — credentials sent in plaintext |
| NewCredentials (9) | RunAs /netonly | Service accounts |
| RemoteInteractive (10) | RDP sessions | Service accounts, Tier 0 identities on non-privileged machines |
| CachedInteractive (11) | Laptops in offline mode | Service accounts |
Patterns worth investigating:
- A service account with Interactive or RemoteInteractive logon types suggests the account credentials are being used interactively — the account may be compromised or misused
- NetworkCleartext on any identity means credentials are being transmitted in plaintext — find and remediate the application using basic authentication
- NTLM count significantly higher than Kerberos may indicate a forced protocol downgrade or SPN misconfiguration
Session Fidelity and Restricted Admin Mode
Session connections carry a fidelity tier that reflects actual credential exposure risk:
- Tier 3 (Validated): The identity authenticated without Restricted Admin Mode — credentials were presented to and cached by the target machine. This represents real credential exposure.
- Tier 2 (Constrained): The session used Restricted Admin Mode (RDP with
/restrictedadmin). The user was authenticated using the machine's network identity, not their own cached credentials. Real session, reduced exposure.
Fidelity only ratchets upward. If an identity ever authenticates without Restricted Admin Mode, the edge stays at Tier 3 regardless of subsequent restricted sessions — a single credential exposure event cannot be undone by later restricted sessions.
Finding Anomalous Session Patterns
To identify session connections worth investigating:
- Navigate to Graph Explorer in the sidebar
- Search for an identity (e.g., a service account name) and select it to focus the graph
- Look for session connections (cyan edges)
- Click a session edge to open its detail panel
- Review the logon type breakdown and protocol counts
For a full chronological investigation of an identity's sessions — including filtering, anomaly highlighting, and behavioral context — use the Identity Investigation Timeline instead.
Privilege Connections
When an identity authenticates with elevated privileges (Windows Event 4672 — Special Privileges Assigned to New Logon), the platform creates a privilege connection from that identity to the computer. This is separate from the session connection and captures which specific Windows privileges were active during the logon.
Privilege connections reveal identities that hold dangerous runtime capabilities even when those privileges are not visible in directory group memberships or ACLs. A service account that is not a member of any privileged group may still hold SeDebugPrivilege at runtime if it was granted via local security policy on specific machines.
Privilege Risk Classification
The platform classifies each Windows privilege into one of four risk tiers:
| Risk Tier | Privileges | Why It Matters |
|---|---|---|
| Critical | SeDebugPrivilege, SeImpersonatePrivilege, SeAssignPrimaryTokenPrivilege, SeTcbPrivilege, SeCreateTokenPrivilege | Enables direct credential extraction (LSASS memory read, token theft) or creation of arbitrary security tokens |
| High | SeBackupPrivilege, SeRestorePrivilege, SeTakeOwnershipPrivilege, SeLoadDriverPrivilege, SeEnableDelegationPrivilege, SeManageVolumePrivilege | Enables privilege escalation, indirect credential access (SAM/NTDS.dit extraction), or kernel driver loading |
| Medium | SeSecurityPrivilege, SeAuditPrivilege, SeSystemEnvironmentPrivilege, SeTrustedCredManAccessPrivilege, SeSyncAgentPrivilege | Enables evidence destruction, UEFI persistence, or stored credential harvesting |
| Low | All other privileges | Minimal attack surface on their own |
Privilege connections with at least one Critical or High privilege are flagged as admin-equivalent. This surfaces identities that have effective admin access through local policy rather than group membership — which directory-only tools cannot detect.
Finding Admin-Equivalent Identities via Privilege Connections
To find identities with admin-equivalent privileges not visible in group memberships:
- Navigate to Graph Explorer
- Search for a computer of interest (e.g., a domain controller or critical server) and select it
- Look for privilege connections arriving at the computer — these are identities that held elevated privileges during a logon to this machine
- Connections from identities with Critical or High privileges will appear in the edge detail panel with the privilege names listed
Privilege connections are also visible from the identity side. Search for a specific identity and look for outgoing privilege connections to see which computers it has held elevated runtime privileges on.
Session and Privilege Connections in the Timeline
For a chronological view of an identity's sessions and privilege events, use the Identity Investigation Timeline. The timeline shows each session as a separate entry with full logon/logoff timing, source IP, and authentication detail — more investigative depth than the aggregated edge view in the Graph Explorer.