Risk Posture Dashboard
A unified view of your organization's identity risk, combining eight security factors into a single composite score with trend analysis, time series breakdowns, and actionable findings.
Requires role: Operator+
Related: Identity Inventory, Stale Identity Detection, Over-Permission Analytics, Critical Junctions, Tier 0 Exposure, Delegation Posture, Select Fire, Detection Alerts, Multi-Agent Intelligence, Bridge Configuration, Telemetry Pipeline, License Enforcement
Overview
The Risk Posture Dashboard is the default landing page after login. It provides an executive-ready view of identity risk across your environment by combining eight security signals into a single composite Identity Risk Score (0–100, where 0 is perfect and 100 is critical risk).
The dashboard is organized as a five-tier information hierarchy:
- Hero Section — Composite score gauge with letter grade and trend chart
- Factor Cards — Eight risk factor cards in a 4×2 grid with sparkline trends
- Time Series Charts — Risk distribution and identity type distribution over time
- Top Findings — Highest-risk identities across all categories with drill-down
- Platform Health — Operational health indicators (sync freshness, telemetry coverage, etc.)
The eight risk factors are:
- Permission Load — Severity-weighted permission exposure compared to peers
- Criticality Gap — Identities reaching critical assets from low-criticality positions
- Junction Score — Identities flagged as critical junctions (high-leverage convergence points)
- Alert Severity — Detection alerts weighted by severity and blast radius
- Staleness — Accounts exceeding type-specific inactivity thresholds
- Tier 0 Exposure — Computers where Tier 0 credentials are at active risk of extraction
- Group Hygiene — Excessive group nesting depth and empty group proliferation
- Delegation Risk — Conformance of custom OU/container delegations against best practices
Prerequisites
- Role: Operator or Admin
- Data: At least one successful identity sync from an LDAP bridge or Entra ID provider
- Analytics: The post-sync analytics pipeline must have completed at least once (runs automatically after each full sync)
NOTE
The dashboard loads immediately after your first sync. Trend data appears after at least one daily snapshot has been recorded (snapshots are created automatically after each analytics cycle).
Accessing the Dashboard
The dashboard is available at /dashboard and is the default landing page — after logging in, you are automatically redirected here. You can also select Dashboard in the left sidebar at any time.
The dashboard automatically refreshes every 5 minutes and recalculates when you switch back to the browser tab.
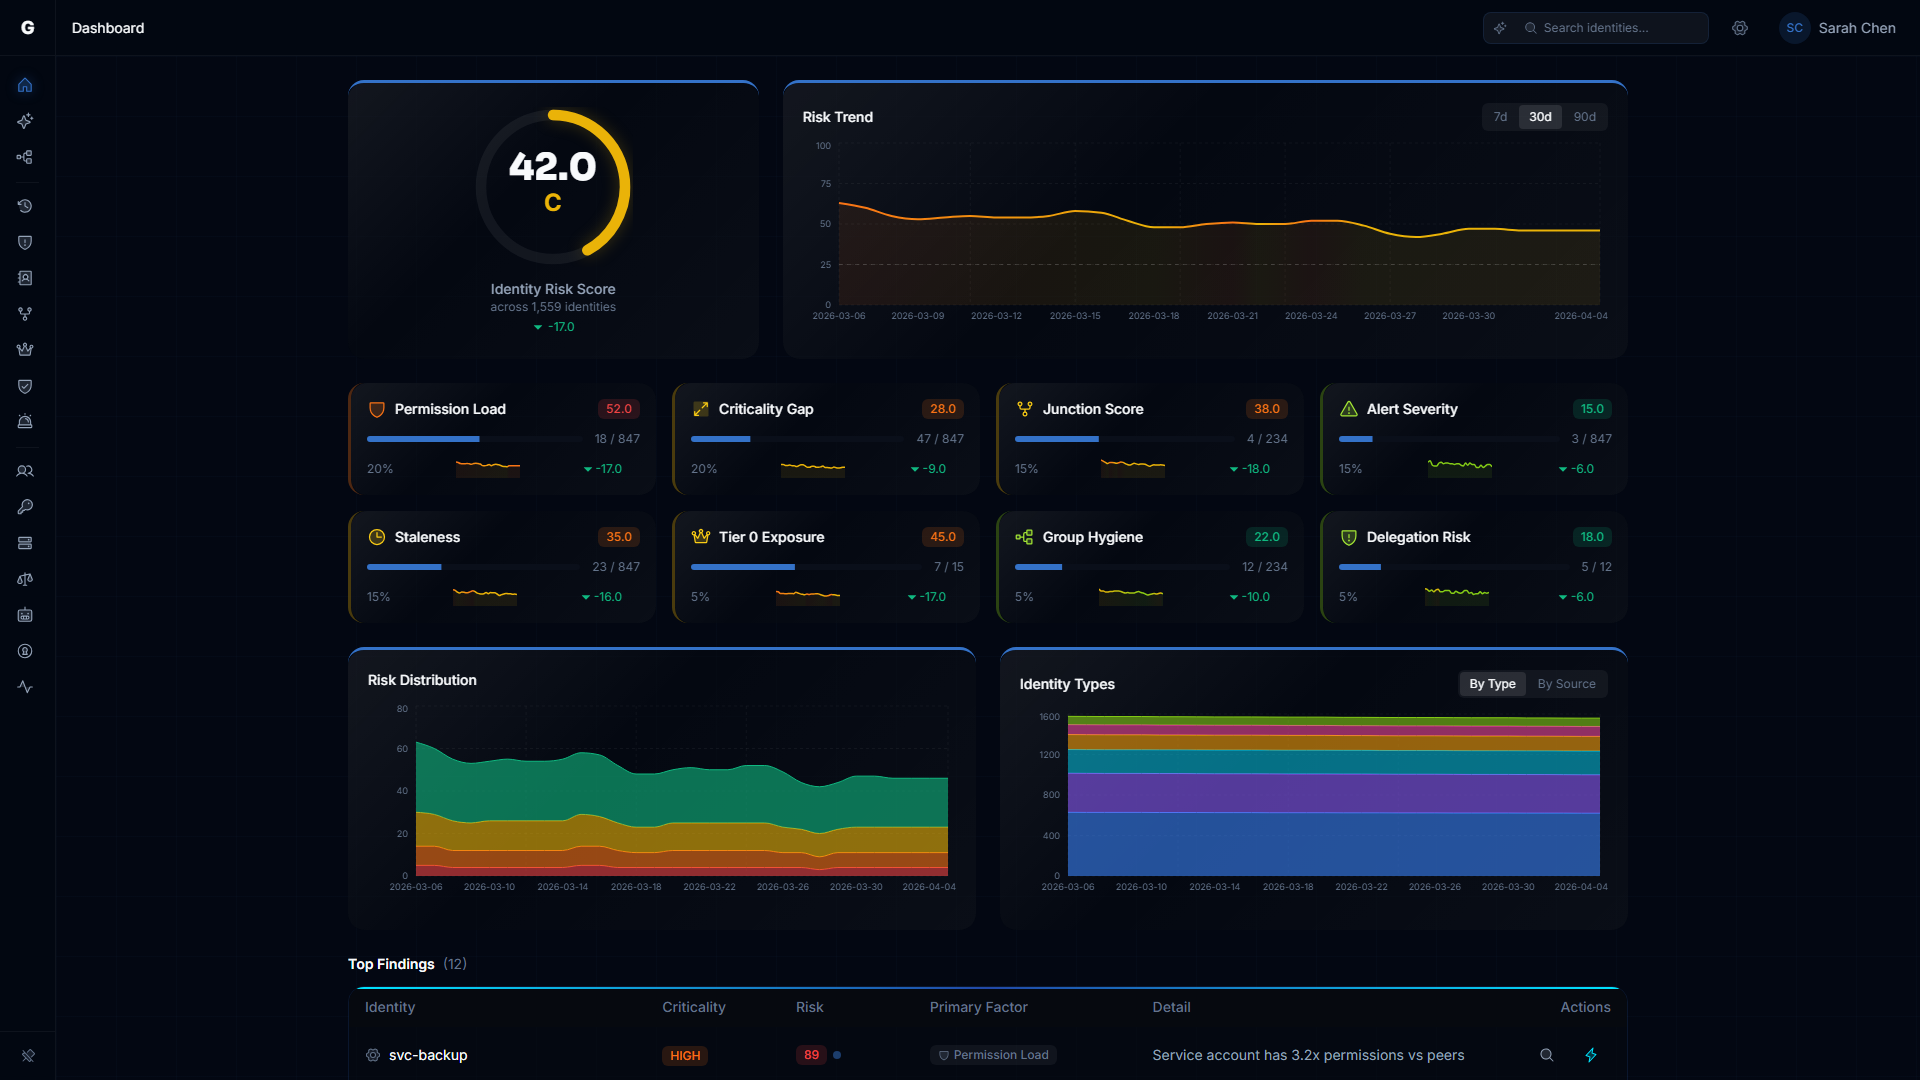
Hero Section: Score Gauge & Trend Chart
Composite Score Gauge
The left side of the hero section displays a circular gauge with:
- The numeric composite score (0–100)
- A letter grade (A/B/C/D/F)
- The total number of identities evaluated
- A delta indicator showing score change over the selected time range
| Score Range | Grade | Color | Interpretation |
|---|---|---|---|
| 0–10 | A | Green | Excellent identity hygiene — minimal findings |
| 11–25 | B | Lime | Good posture — minor issues to monitor |
| 26–50 | C | Yellow | Fair posture — action recommended |
| 51–75 | D | Orange | Poor posture — significant risk |
| 76–100 | F | Red | Critical risk — immediate action required |
Trend Chart
The right side shows the composite score trend over the selected time range. A reference line at score 25 marks the boundary between Grade B and Grade C — the recommended target.
Use the time range selector in the chart header to choose 7, 14, 30, 60, or 90 days. This selection applies to all dashboard widgets: the gauge delta, factor card sparklines, and time series charts.
What to look for:
- Downward slope: Risk is decreasing — findings are being remediated
- Upward slope: Risk is increasing — new findings accumulating
- Flat line: Stable baseline for comparison
Factor Cards
Eight cards in a 4×2 grid show each risk factor's contribution to the composite score. Each card displays:
- Score (0–100) with color-coded letter grade
- Finding Count / Total Count — Raw numbers (e.g., "23 / 4,200")
- Weight — This factor's percentage contribution to the composite score
- Sparkline — Score trend over the selected time range, color-coded by grade
- Delta — Score change (up or down) over the selected period
Click the arrow on any factor card to drill through to the relevant analysis page.
Permission Load
Identities with effective permission counts (direct + inherited through group membership) that significantly exceed their peer group's average. Peer groups are formed by identity type, department, and title within each domain.
Drill-through: Identity Inventory, Over-Permissioned filter
Criticality Gap
Identities that reach high-criticality assets despite having low criticality themselves. This signals a PoLP (Principle of Least Privilege) violation — a low-tier identity shouldn't have access paths to Tier 0 assets.
Drill-through: Identity Inventory, sorted by risk
Junction Score
Identities flagged as critical junctions — structural convergence points where low-privilege and high-privilege zones meet in the access graph. Compromising a junction provides an attacker with a path from entry to domain control.
Drill-through: Critical Junctions page
Alert Severity
Active detection alerts weighted by severity and the blast radius of the targeted identity. A CRITICAL alert against a Tier 0 service account scores higher than a LOW alert against a standard user.
Drill-through: Detection Alerts page
Staleness
Accounts that haven't been used within their type-specific threshold:
- Users, Groups, Roles: 90 days
- Computers, Devices: 30 days
- Service Accounts, Service Principals, Applications: 180 days
Drill-through: Identity Inventory, Stale filter
Tier 0 Exposure
Computers where Tier 0 credentials are actively at risk — a Tier 0 identity is logged into a machine where a lower-privileged identity holds credential-theft privileges (e.g., the ability to dump LSASS or back up the SAM database). This is a real-time telemetry-based finding, not a hygiene check. See the Tier 0 Exposure guide for full details.
Drill-through: Identity Inventory, Tier 0 Exposed filter
WARNING
Tier 0 exposure findings are always CRITICAL severity. Even a single exposed credential on one computer represents a direct path to full domain compromise.
Group Hygiene
Excessive group nesting depth (deeply nested groups complicate audit and expand attack surface) and empty group proliferation (groups with no members that still hold permissions).
Drill-through: Identity Inventory, Groups tab, excessive nesting filter
Delegation Risk
Conformance of custom OU and container delegations against Microsoft best practices. The system evaluates breadth, severity, scoping quality, trustee health, and cross-plane delegation risks.
Drill-through: Delegation Posture page
For detailed delegation analysis, see the Delegation Posture guide.
Time Series Charts
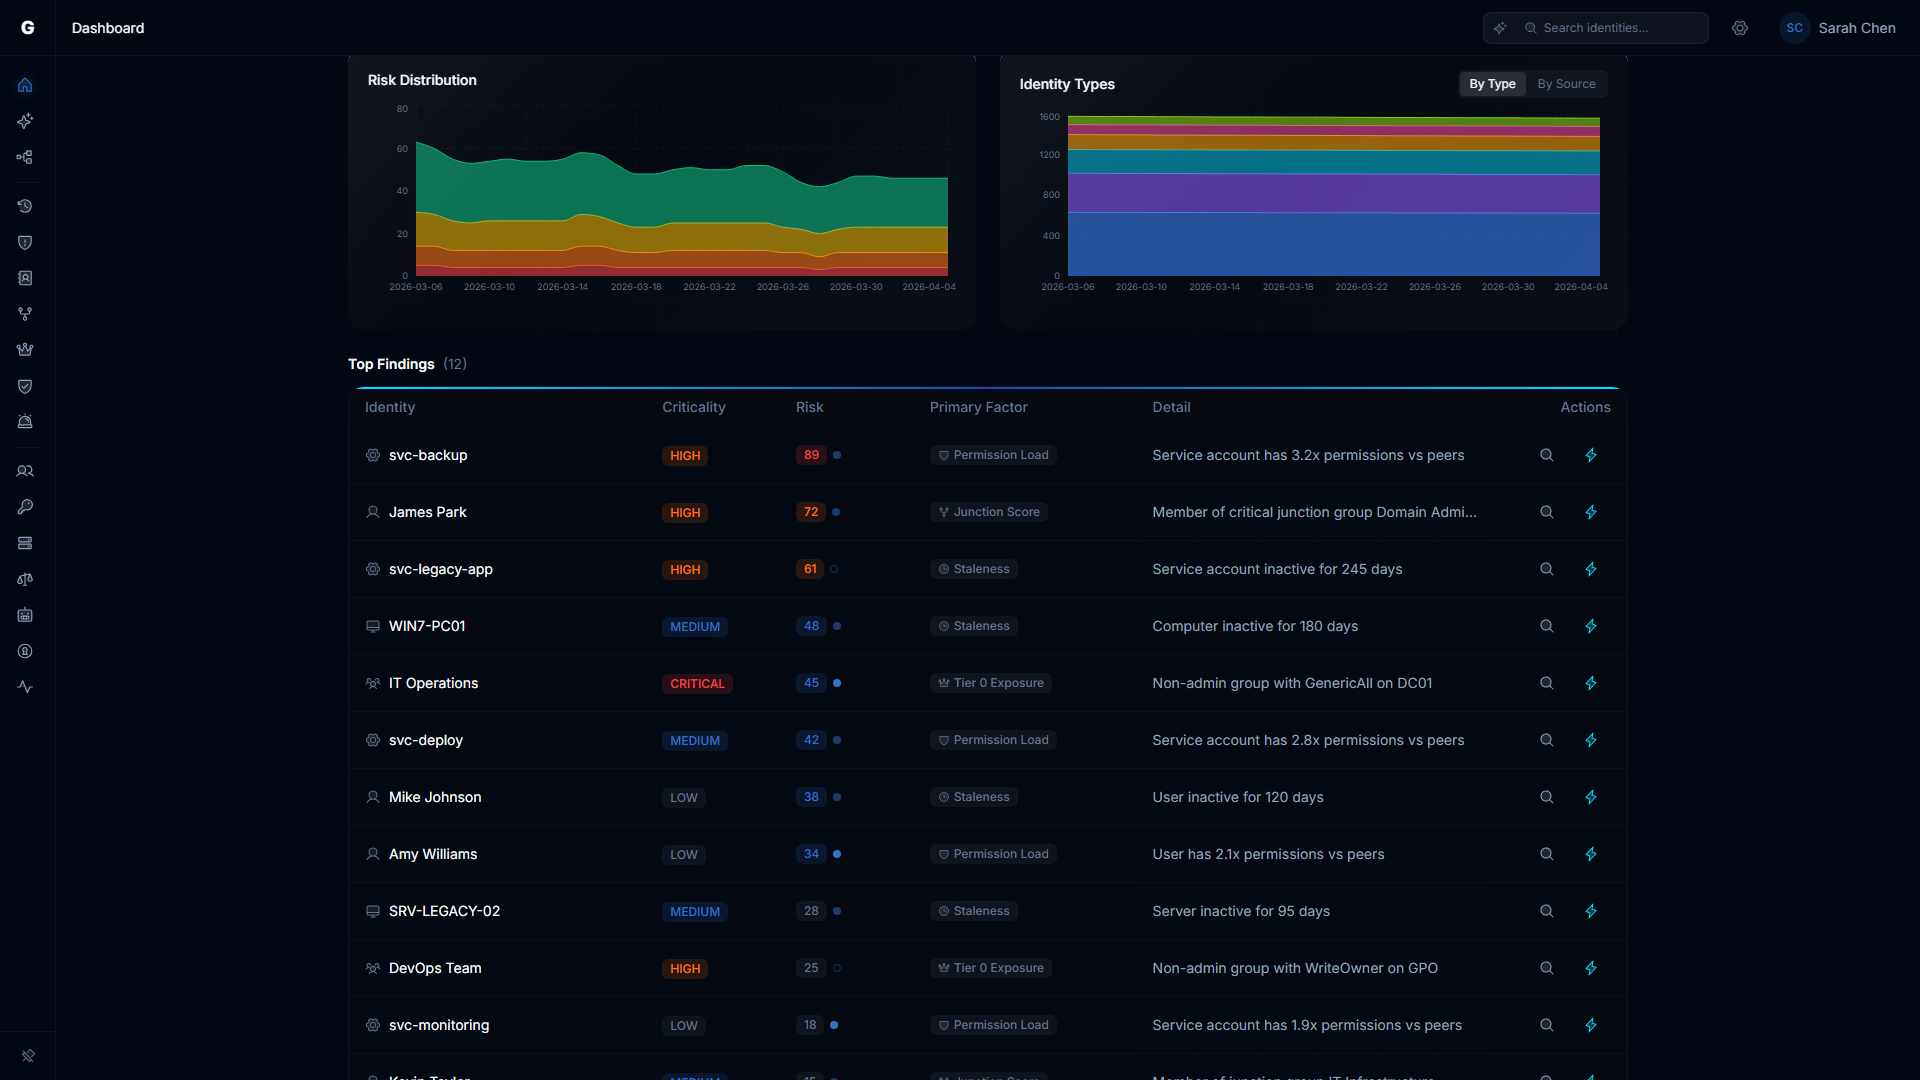
Two side-by-side charts provide deeper historical context:
Risk Distribution Over Time
A stacked area chart showing how identities are distributed across risk levels (Critical, High, Medium, Low, None) over the selected time range. This reveals whether high-risk identities are being remediated or accumulating.
Identity Type Distribution Over Time
A stacked area chart showing identity counts by source type (on-premises, cloud, hybrid) over time. Useful for tracking environment growth and hybrid identity adoption.
Both charts respect the same time range selector from the trend chart.
Top Findings
The Top Findings table lists the highest-risk identities across all analysis categories. Findings are sorted by severity and risk impact.
Each row shows:
| Column | Description |
|---|---|
| Identity | Display name with type icon |
| Category | Stale, Over-Permission, Junction, or Tier 0 |
| Severity | CRITICAL, HIGH, or MEDIUM (color-coded badge) |
| Detail | Brief description (e.g., "Stale for 180 days", "Junction score: 14.2") |
| Risk Factor | Which dashboard factor this finding contributes to |
| Actions | Select Fire (lightning icon) and AI Explain (click the finding detail text, if AI agent is available) |
Interacting with Findings
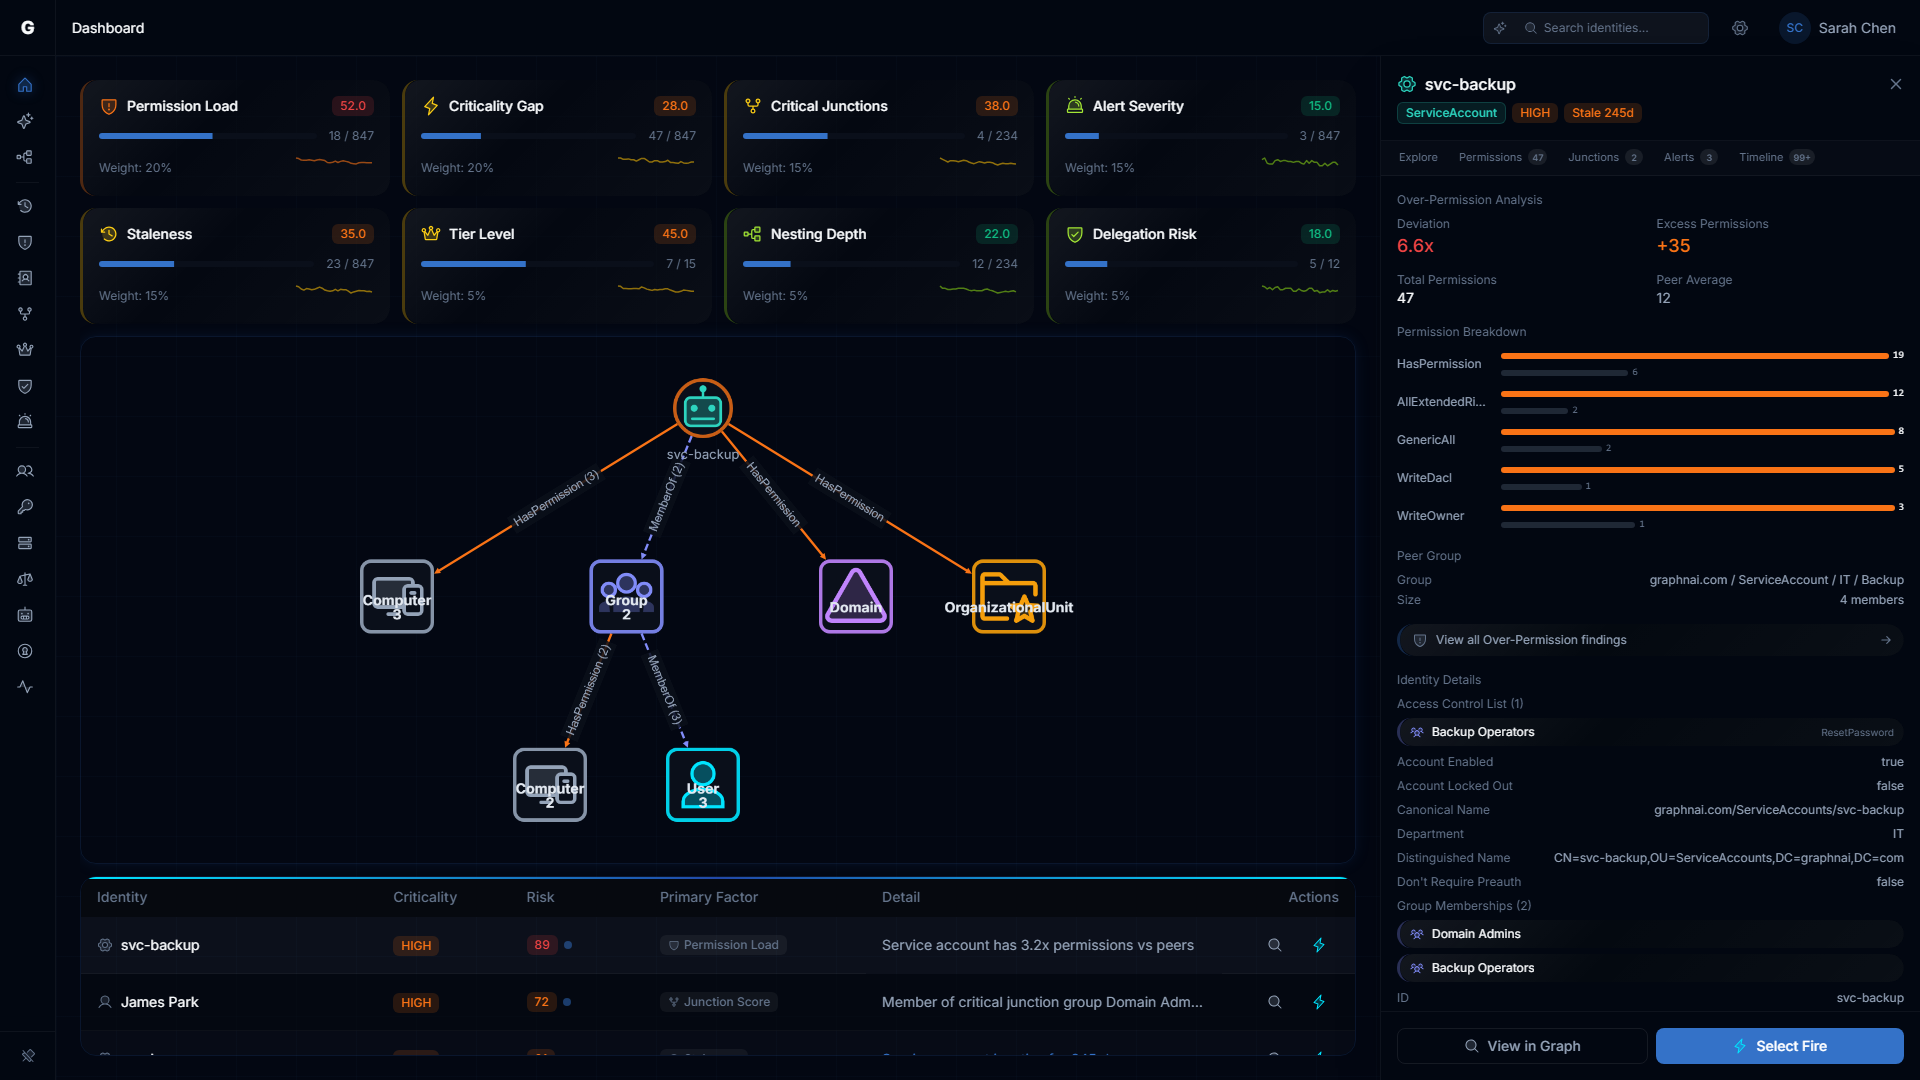
- Click a row to open a detail flyout on the right side with:
- Identity properties and context
- Graph visualization (blast radius, permission graph, or junction flow depending on category)
- Investigation tabs (explore, permissions, membership, timeline, etc.)
- Select Fire button for remediation
- Click the lightning icon to open Select Fire directly for that identity
- Click the finding detail text (if AI agent is configured and you have Operator role) to get an AI-generated explanation of why this finding matters and what to do about it
Customizing Factor Weights
Click the settings gear icon in the top bar while on the dashboard to open the Risk Weight Dialog.
The dialog shows a slider for each of the eight risk factors. As you adjust sliders, the composite score updates in real-time to preview the impact. Click Apply to save your weights or Reset to restore defaults.
Use cases:
- Emphasize Tier 0 Exposure if privileged access governance is your top priority
- Increase Alert Severity weight during an active incident response
- Reduce Staleness weight if your organization has a long offboarding cycle by design
Rules:
- Weights are automatically normalized to sum to 100%
- Setting all weights to zero is not allowed
- Weight preferences persist across browser sessions
Platform Health
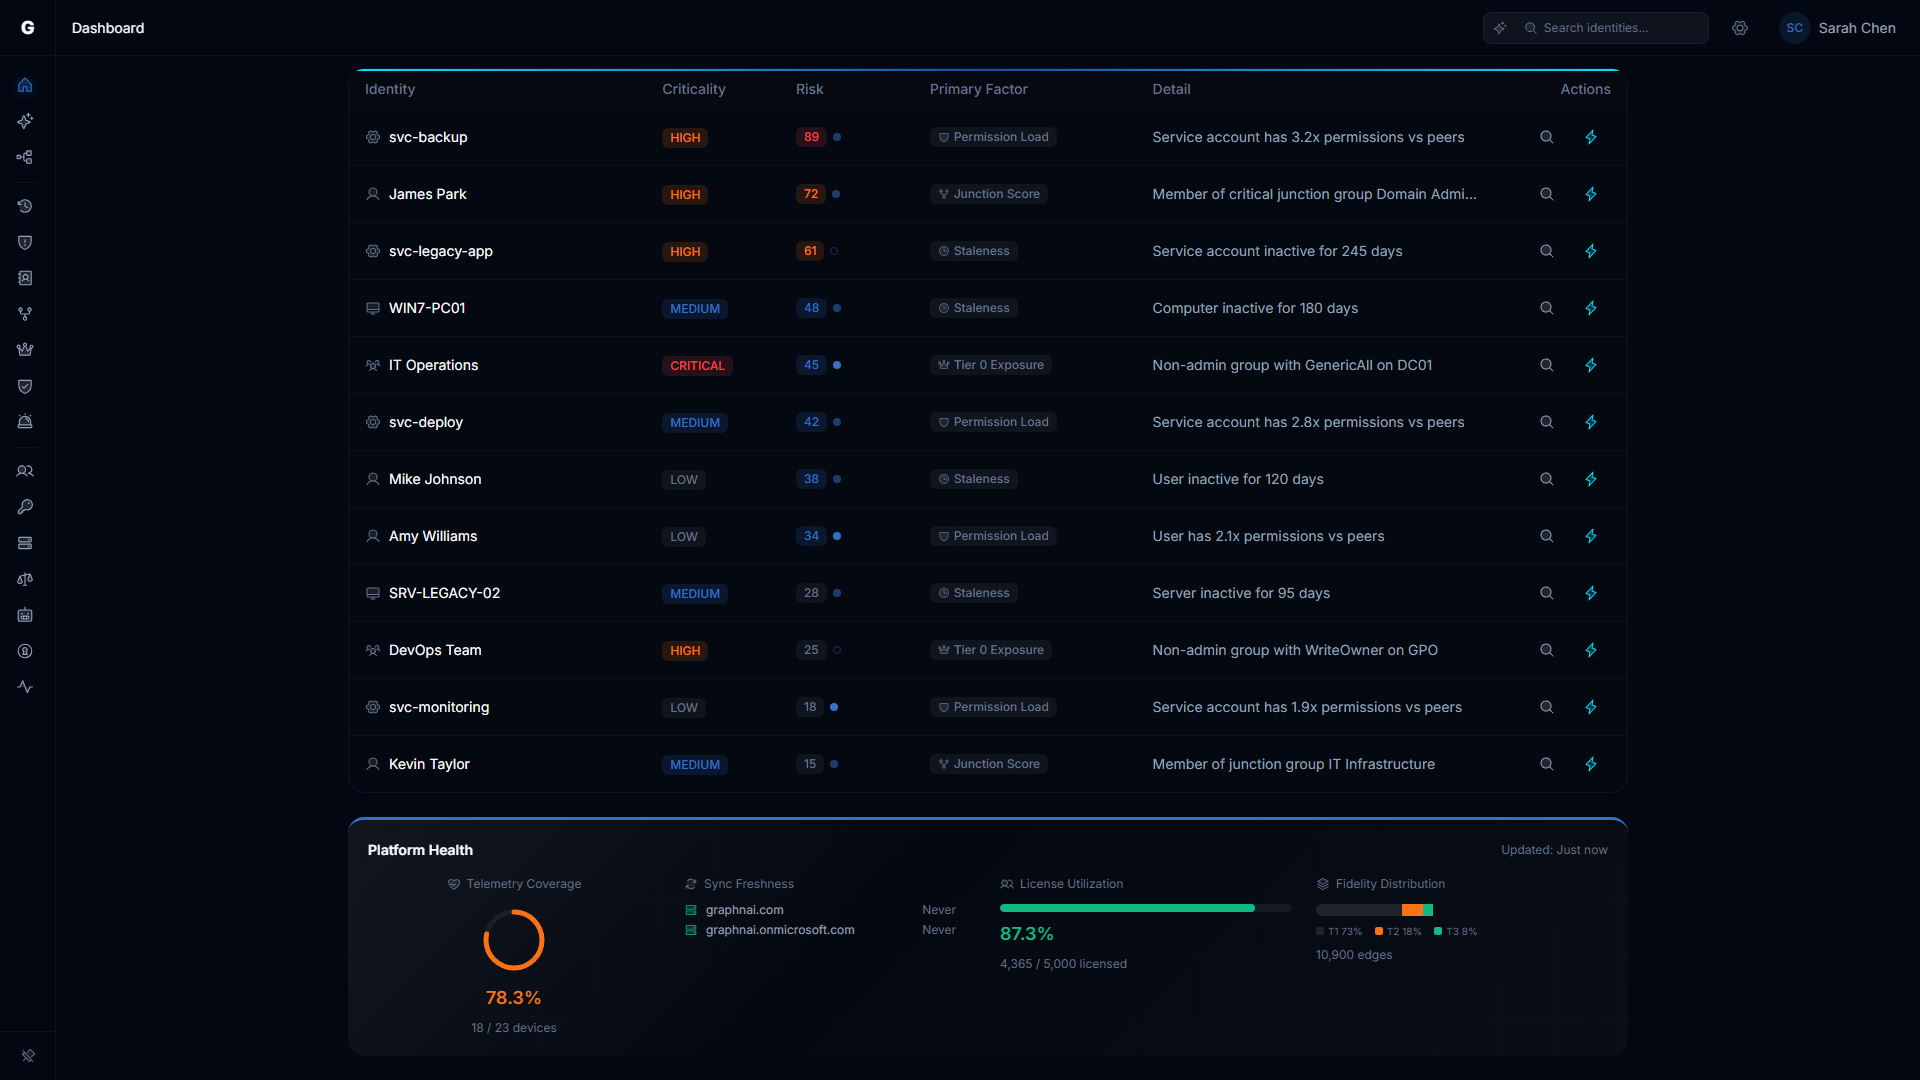
The bottom of the dashboard shows Platform Health Indicators — operational metrics about the platform itself (not identity risk). While the risk score tells you what is wrong with your identity posture, Platform Health tells you how well the platform is configured to find those issues. The section appears after your first successful sync.
Seven indicators are shown in a horizontal layout. The section shows a "Last updated" timestamp in the top-right corner, reflecting when the analytics pipeline last ran — typically immediately after a full sync completes.
Telemetry Coverage
The circular arc gauge shows what percentage of your enabled Computer and Device identity nodes have at least one telemetry edge (session or privilege observation).
| Color | Meaning |
|---|---|
| Green | 80% or more devices covered |
| Amber | 50%--79% coverage — some blind spots |
| Red | Below 50% — significant coverage gaps |
The count below the gauge (for example, "142 / 180 devices") shows the raw numbers. Devices with no telemetry are not included in threat detection based on behavioral signals, so low coverage means some detections may never trigger for those machines.
To improve coverage: Ensure the Identity Bridge agent is deployed on domain controllers and that Windows Event Forwarding (or the OTLP telemetry receiver) is configured on the machines you want to monitor. See the Telemetry Pipeline guide.
Sync Freshness
Each configured domain appears as a row with:
- A domain type icon: hard drives for on-premises (AD/LDAP), cloud for Entra ID
- The domain name
- A relative timestamp (for example, "3 hours ago")
| Color | Meaning |
|---|---|
| Green | Synced within the last 24 hours |
| Amber | Last sync was 24--72 hours ago |
| Red | Last sync was more than 72 hours ago, or the sync failed |
Admin users can click on any domain row to navigate directly to the responsible source (on-premises domains to the Bridge configuration page, cloud domains to Admin > Identity Providers). Operators see the same freshness information but without the clickable navigation links.
If a domain row shows red due to a failed sync, an additional entry will appear in the Operational Warnings list below with the specific error message.
License Utilization
The horizontal bar tracks total synced identities across all domains against your licensed maximum.
| Status | Color | Meaning |
|---|---|---|
| OK | Green | 80% or more of licensed capacity used — deployment appears complete |
| Underutilized | Blue | Below 80% of licensed capacity — some domains may not be synced yet |
| Exceeded | Red | More identities synced than your license allows |
| Unlicensed | Gray | No license key is configured |
NOTE
The "Underutilized" (blue) state means the platform suspects your sync is incomplete — you are using fewer identities than your license permits, which typically means some domains have not been configured. This is informational, not a warning.
If the status is "Exceeded," contact GraphnAI to discuss an expanded license. See License Enforcement.
Fidelity Distribution
The stacked bar shows how your access relationship data is distributed across three confidence levels (Tiered Fidelity):
| Tier | Label | Color | What it means |
|---|---|---|---|
| T1 | Theoretical | Gray | Access relationships inferred from directory structure (group memberships, OU containment). No observed use. |
| T2 | Constrained | Amber | Access relationships validated by configuration evidence (GPO settings, delegation ACLs). |
| T3 | Validated | Green | Access relationships confirmed by observed authentication or privilege use events from telemetry. |
A higher proportion of Tier 3 (green) means your risk findings are backed by observed behavior. A graph with mostly Tier 1 data is still useful for structural analysis, but behavioral detections require Tier 3 evidence. To increase Tier 3 coverage: enable telemetry collection on domain controllers. See Telemetry Pipeline.
Audit Policy Gaps
This list appears only when the platform detects detection rules that are unlikely to fire due to missing Windows audit configuration. The platform checks whether the Event IDs required by each detection rule have ever been seen in telemetry for a given domain. If a domain has been sending telemetry for 7 or more days and none of the required Event IDs have been observed, the platform flags this as a likely missing audit policy.
Each gap entry shows the detection rule name, the Windows audit subcategory to enable, a "Possible" confidence badge, and the affected domain.
| Detection Rule | Required Event IDs | Windows Audit Subcategory |
|---|---|---|
| Brute Force Detection | 4625, 4771, 4776 | Audit Logon + Audit Kerberos Authentication Service |
| Password Spray Detection | 4625 | Audit Logon |
| Kerberoasting Detection | 4769 | Audit Kerberos Service Ticket Operations |
| DCSync Detection | 4662 | Audit Directory Service Access |
| Tier 0 Group Change Detection | 4728, 4729, 4732, 4733, 4756, 4757 | Audit Security Group Management |
| Audit Tampering Detection | 4719 | Audit Policy Change |
To resolve a gap: Enable the listed audit subcategory via Group Policy on your domain controllers. The gap will clear from this list once the required events begin appearing in telemetry.
NOTE
Gaps are only evaluated for domains that have had active telemetry for at least 7 days. Newly connected domains will not show audit policy gaps until this threshold is reached.
Unconfigured Domains
Domains that the platform has detected but that have no corresponding sync configuration. Each entry shows:
- The domain name
- How it was detected (one or more source badges): dns-discovery, entra-sync, or telemetry
- Identity count (for Entra-detected domains) or event count (for telemetry-detected domains)
Admin users see a "Configure" link next to each entry that navigates to the Bridges page to set up a new sync source. To remove an entry from this list, configure a bridge or identity provider that covers the domain, then trigger a full sync.
NOTE
Common system names (NT AUTHORITY, BUILTIN, NT SERVICE, and similar) are automatically excluded from this list. Only genuine domain names are shown.
Operational Warnings
This list appears only when there are active issues:
- Bridge connection warnings — a bridge agent that is disconnected or in an error state
- Recent sync failures — syncs that failed or partially completed within the last 3 days
Each warning shows the affected domain, the source (bridge or sync), the error message, and when it occurred. An empty list means all bridges are connected and recent syncs have completed successfully.
Interpreting Edge Cases
Composite score is 0: No findings detected. This is the ideal state (Grade A).
A factor score is 0: No findings in that category. Normal for small environments.
"No data" on a factor card: The analytics pipeline hasn't run yet for that metric. Trigger a full sync to populate.
Trend chart shows no data: No daily snapshots recorded yet. Snapshots are created automatically after each analytics cycle. Wait for the next full sync to complete.
Troubleshooting
Dashboard shows empty state
Possible causes:
- No identity data synced — At least one sync must complete before the dashboard has data
- Fix: Go to Bridges in the sidebar and trigger a sync
- Analytics pipeline hasn't run — Junction scores and risk factors require the post-sync analytics pipeline
- Fix: Trigger a full sync (not delta). Analytics run automatically after full syncs.
- Database connectivity — The server can't reach the database
- Fix: Check server logs and verify the readiness endpoint returns 200
Score seems too high or too low
- Check the factor cards to see which factor is driving the score
- Tier 0 Exposure can dominate because it's calculated as a percentage of Tier 0 assets only — 3 out of 12 Tier 0 assets with issues = 25% score
- Adjust factor weights via the settings gear if a factor is overrepresented for your environment
Over-Permission score is zero
Over-permission results are pre-computed after each full sync. If analytics haven't run, the cache is empty.
- Fix: Trigger a full sync. Check the sync metrics panel for the "Analytics" phase.
Platform Health section does not appear
Cause: The section is hidden until at least one sync has completed successfully.
Solution:
- Navigate to Bridges in the sidebar and confirm a bridge is configured
- Trigger a sync by clicking the sync button on the bridge card
- Wait for the sync to complete (watch the sync progress indicator)
- Return to the Dashboard — the Platform Health section should now appear
Telemetry Coverage shows 0%
Cause: No Computer or Device nodes have received any telemetry data.
Solution:
- Confirm the telemetry pipeline is active — see Telemetry Pipeline
- Check the server logs for OTLP ingestion messages
- Confirm that at least one event has been received: look for Computer or Device nodes in the Graph Explorer that have session edges attached
An audit policy gap persists after enabling the audit policy
Cause: The gap check requires events to actually be observed — enabling the policy on a domain controller does not immediately generate events.
Solution:
- Confirm the Group Policy was applied (
gpresult /ron a domain controller) - Wait for activity on the domain that would trigger the relevant events
- The gap will clear automatically after the next full sync once the required Event IDs appear in the telemetry stream
Sync Freshness shows red but no Operational Warning appears
Cause: The sync is stale (more than 72 hours old) but completed successfully at the time — it is not a failure, just overdue.
Solution: Navigate to Bridges and trigger a new sync for the affected domain.
License Utilization shows "Unlicensed"
Cause: No valid license key is configured on the server.
Solution: Contact GraphnAI to obtain a license key. See License Enforcement for details.
Related Guides
- Identity Inventory — Unified investigation surface with per-identity risk scoring
- Stale Identity Detection — Detailed breakdown of stale accounts
- Over-Permission Analytics — Peer-group-based detection of excessive permissions
- Critical Junctions — High-leverage accounts bridging privilege tiers
- Tier 0 Exposure — Active credential theft risk for Tier 0 assets
- Delegation Posture — Delegation conformance analysis
- Detection Alerts — ITDR alert management
- Asset Criticality — Automated tier assignment and manual overrides
- Telemetry Pipeline — Set up telemetry collection for Tier 3 promotion and ITDR detection
- Bridge Configuration — Configure domains, sync schedules, and certificates
- License Enforcement — License key configuration and utilization
Best Practices
- Set a target score — Aim for composite score below 25 (Grade B). Communicate this to your security team.
- Track weekly trends — Review the trend chart every Monday to spot upward drift early.
- Prioritize Tier 0 findings — Any Tier 0 finding should be addressed immediately, even if the composite score is low.
- Use factor weights strategically — Increase weights for the areas most critical to your organization's compliance requirements.
- Drill through factor cards — Don't just watch the composite score. Click through to understand what's driving each factor.
- Use the dashboard for executive reporting — The letter grade and trend chart communicate risk posture to non-technical stakeholders effectively.